Learn about Error Rate, including how to measure it, and leverage it in dashboards and visualizations with Metabase.
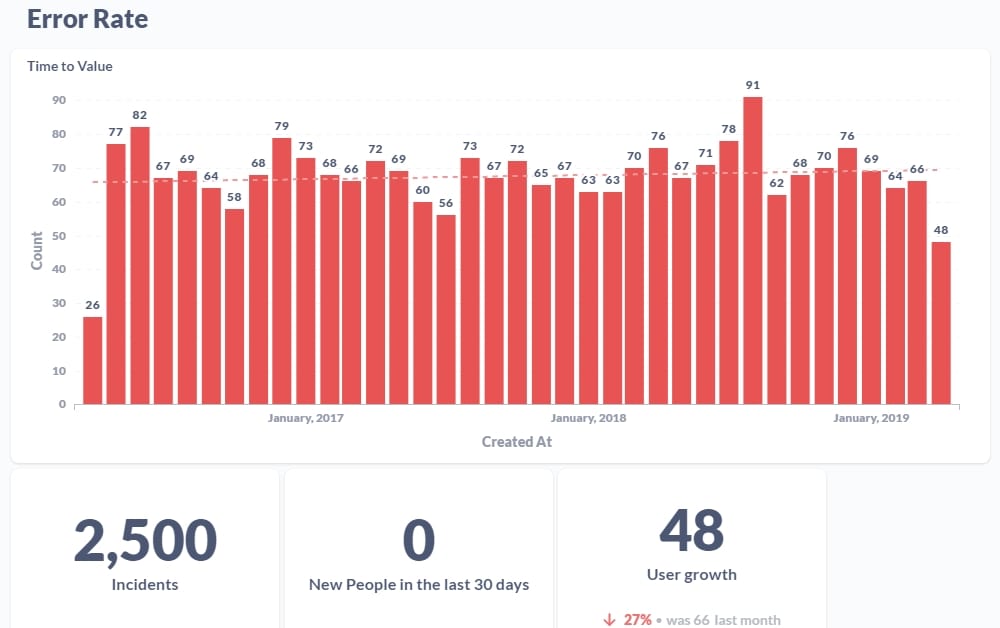
An error rate is how many times a request fails in a given period of time. The purpose of knowing error rates is to determine the efficiency of a web application. Identifying error rates can help DevOps discover efficiency issues and problems that require intervention before launching a product or patch. It can also help your dev teams look at how they’re doing overall in terms of optimization. Error rates are generally used in testing using something like Azure, so you likely won’t see error rates used after the fact unless it’s being used in diagnostics. It’s an essential metric for learning more about how efficient a program is.
Get StartedError rate is represented in a percentage, and can be calculated by taking the total number of failed requests and dividing it by the number of requests total. This’ll be for a pre-determined amount of time, like 1 minute, 10 minutes etc. For example, if you send 100 requests per minute and 50 of them fail, that’s a 50% error rate. That would be considered horrible and can be an indication of a major error happening that requires immediate attention.
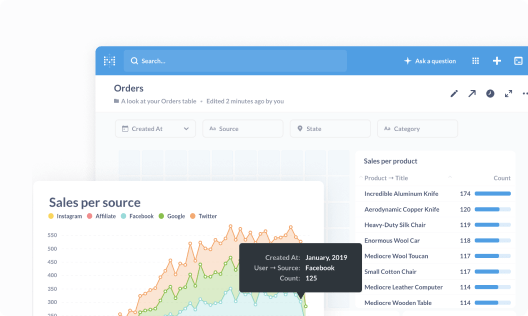
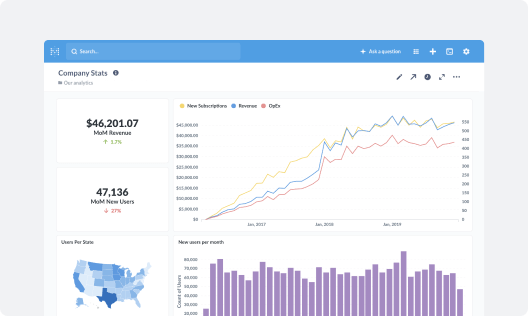
Get everyone on the same page by collecting your most important metrics into a single view.
Take your data wherever it needs to go by embedding it in your internal wikis, websites, and content.
Empower your team to measure their own progress and explore new paths to achieve their goals.
That's right, no sales calls necessary—just sign up, and get running in under 5 minutes.
We connect to the most popular production databases and data warehouses.
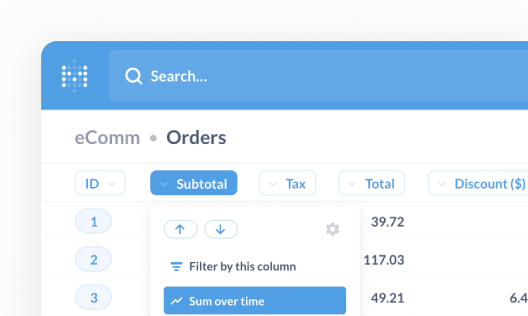
Invite your team and start building dashboards—no SQL required.