‧
5 min read
AWS Startups & Metabase
Sameer Al-Sakran
‧ 5 min read
Share this article
If you spend any time reading hacker news, analytics and business intelligence tend to take on very complex overtones. Big Data. Stream Processing. Real Time. Machine Learning to learn your Machine Learning parameters. Meanwhile, everyone else’s engineering blogs are giving you all the details about how they burned through a couple hundred grand in engineering time to set up some view counters on their home page.
Sometimes you just want to pull some data out of a database.
Maybe you want to let others in your company do so.
Maybe you even want them to be able to make a chart and pass it around.
For all the talk of “company transformation”, expensive conference booths and 6 to 7-figure sticker shock, at its heart, analytics can actually be fairly simple and incremental. Enter Metabase.
What exactly is Metabase?
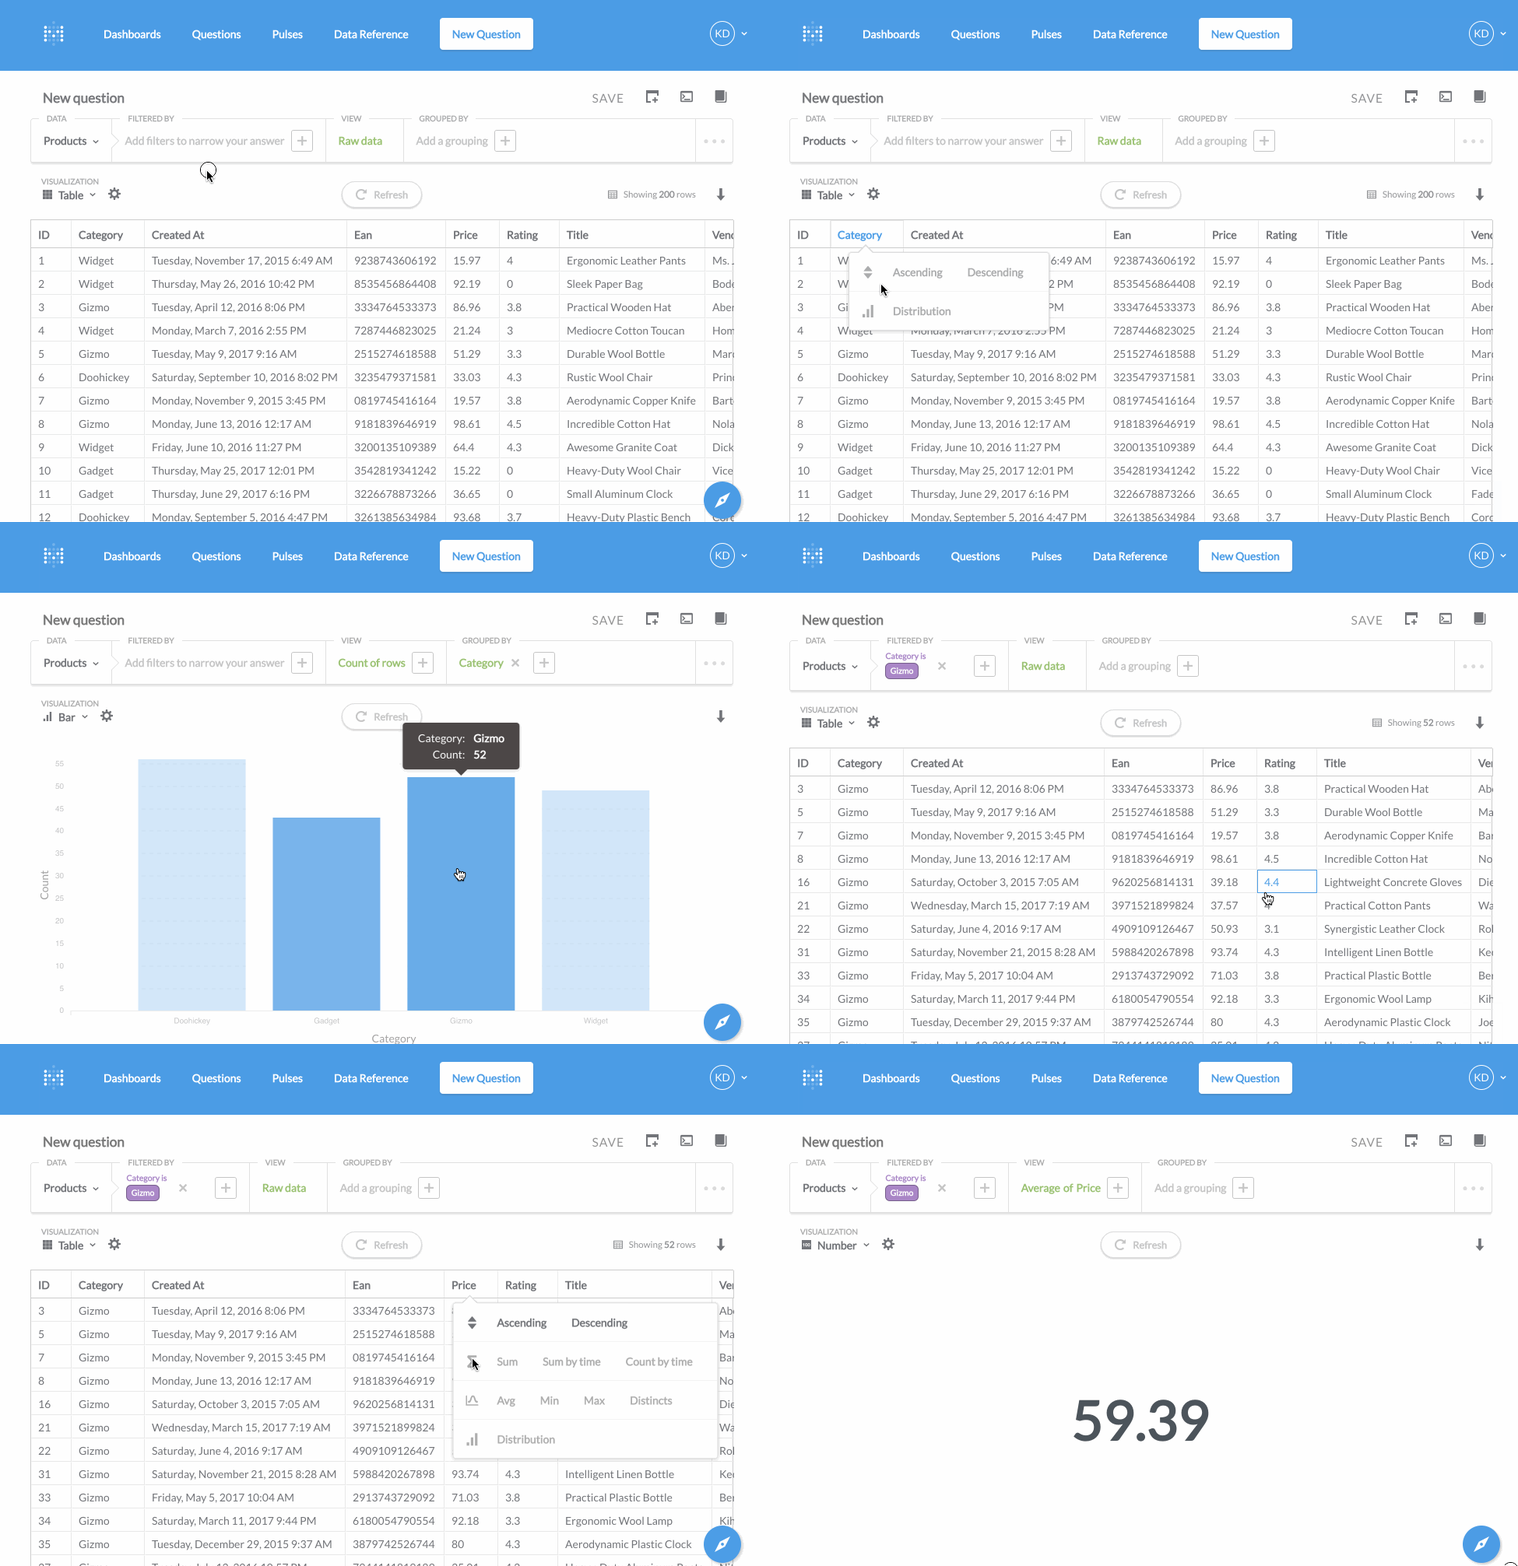
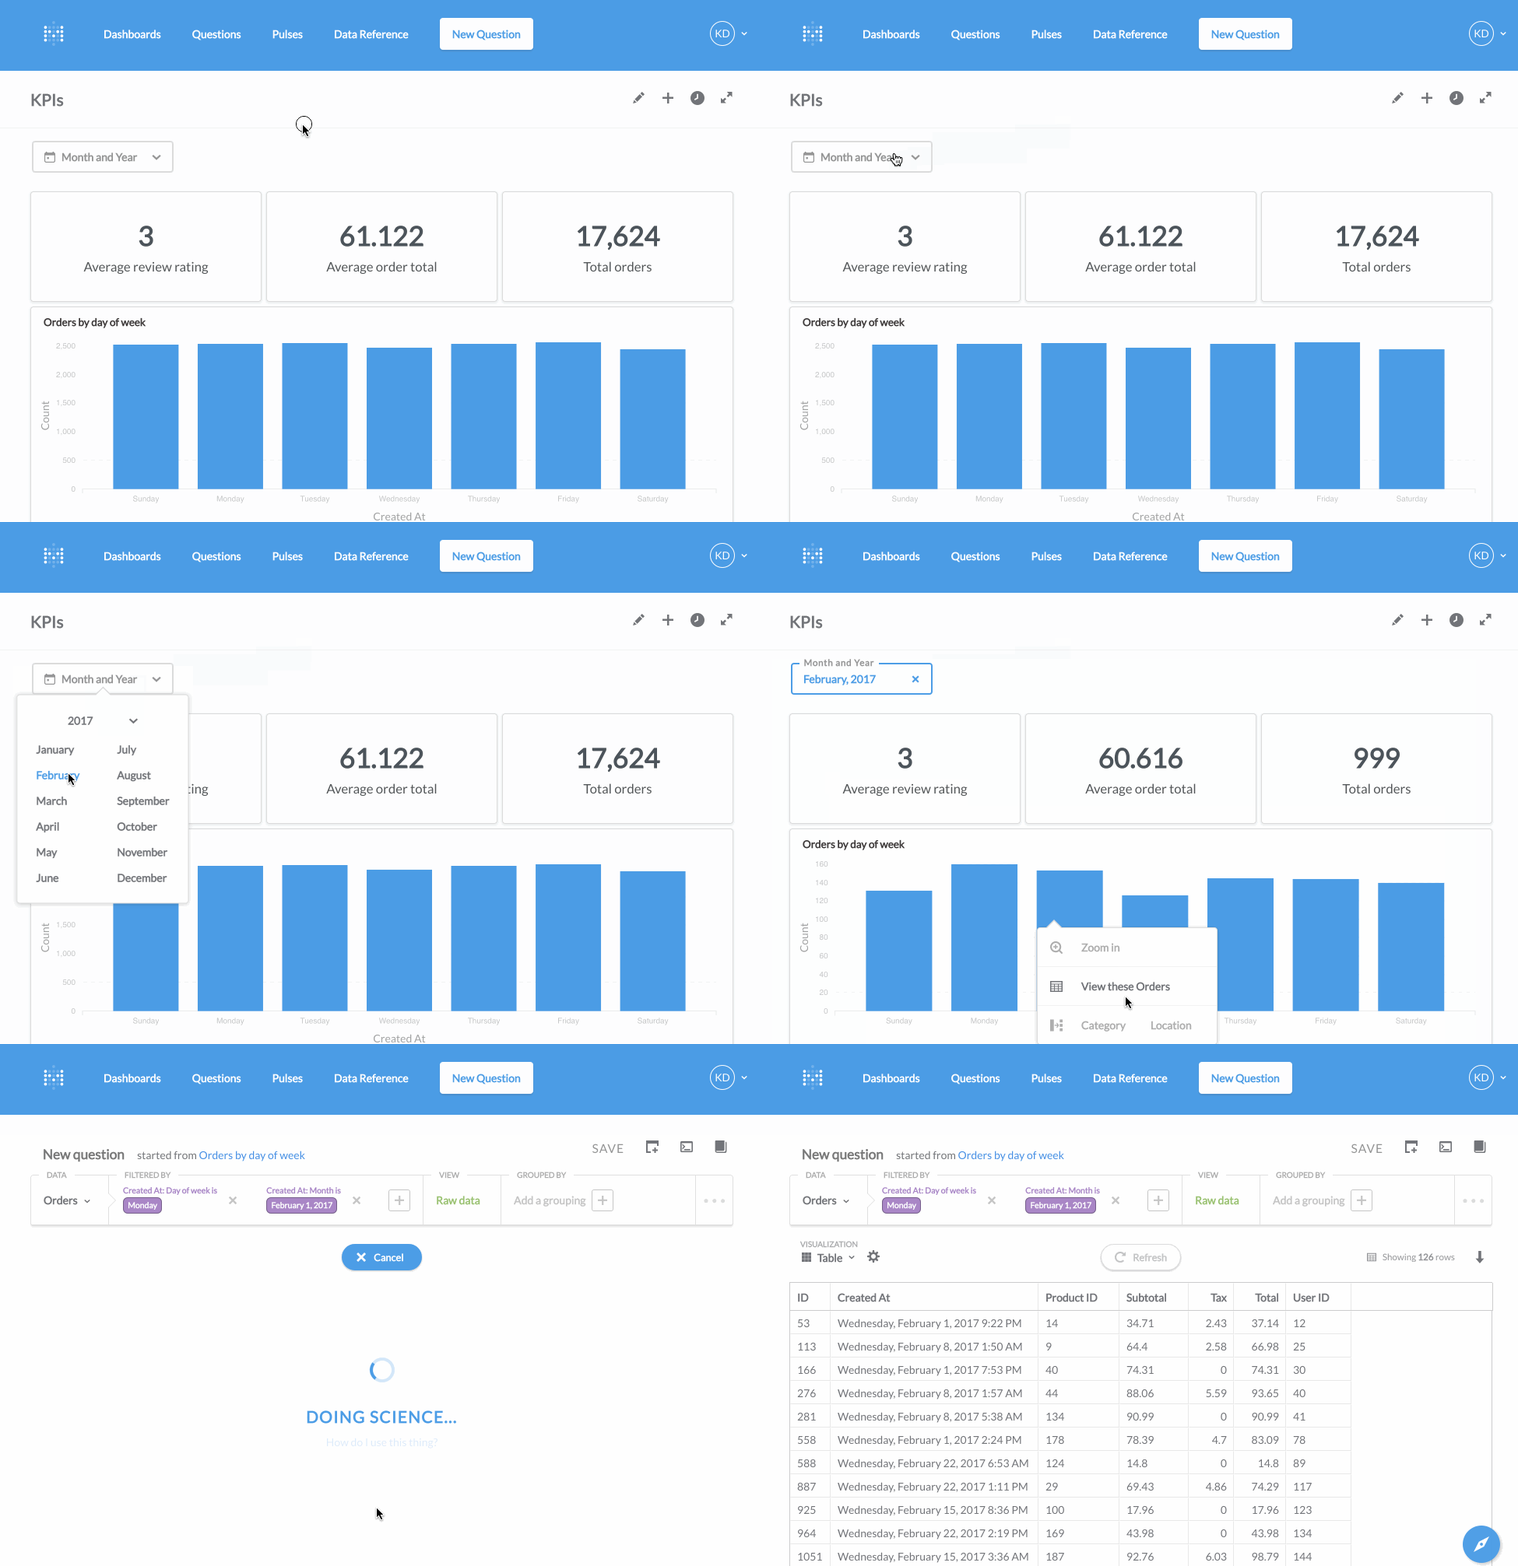
Metabase is the simplest way to get data in front of anyone on your team. Using a simple graphical interface, anyone in your company can create dashboards, set up nightly emails, or ask simple questions on their own.

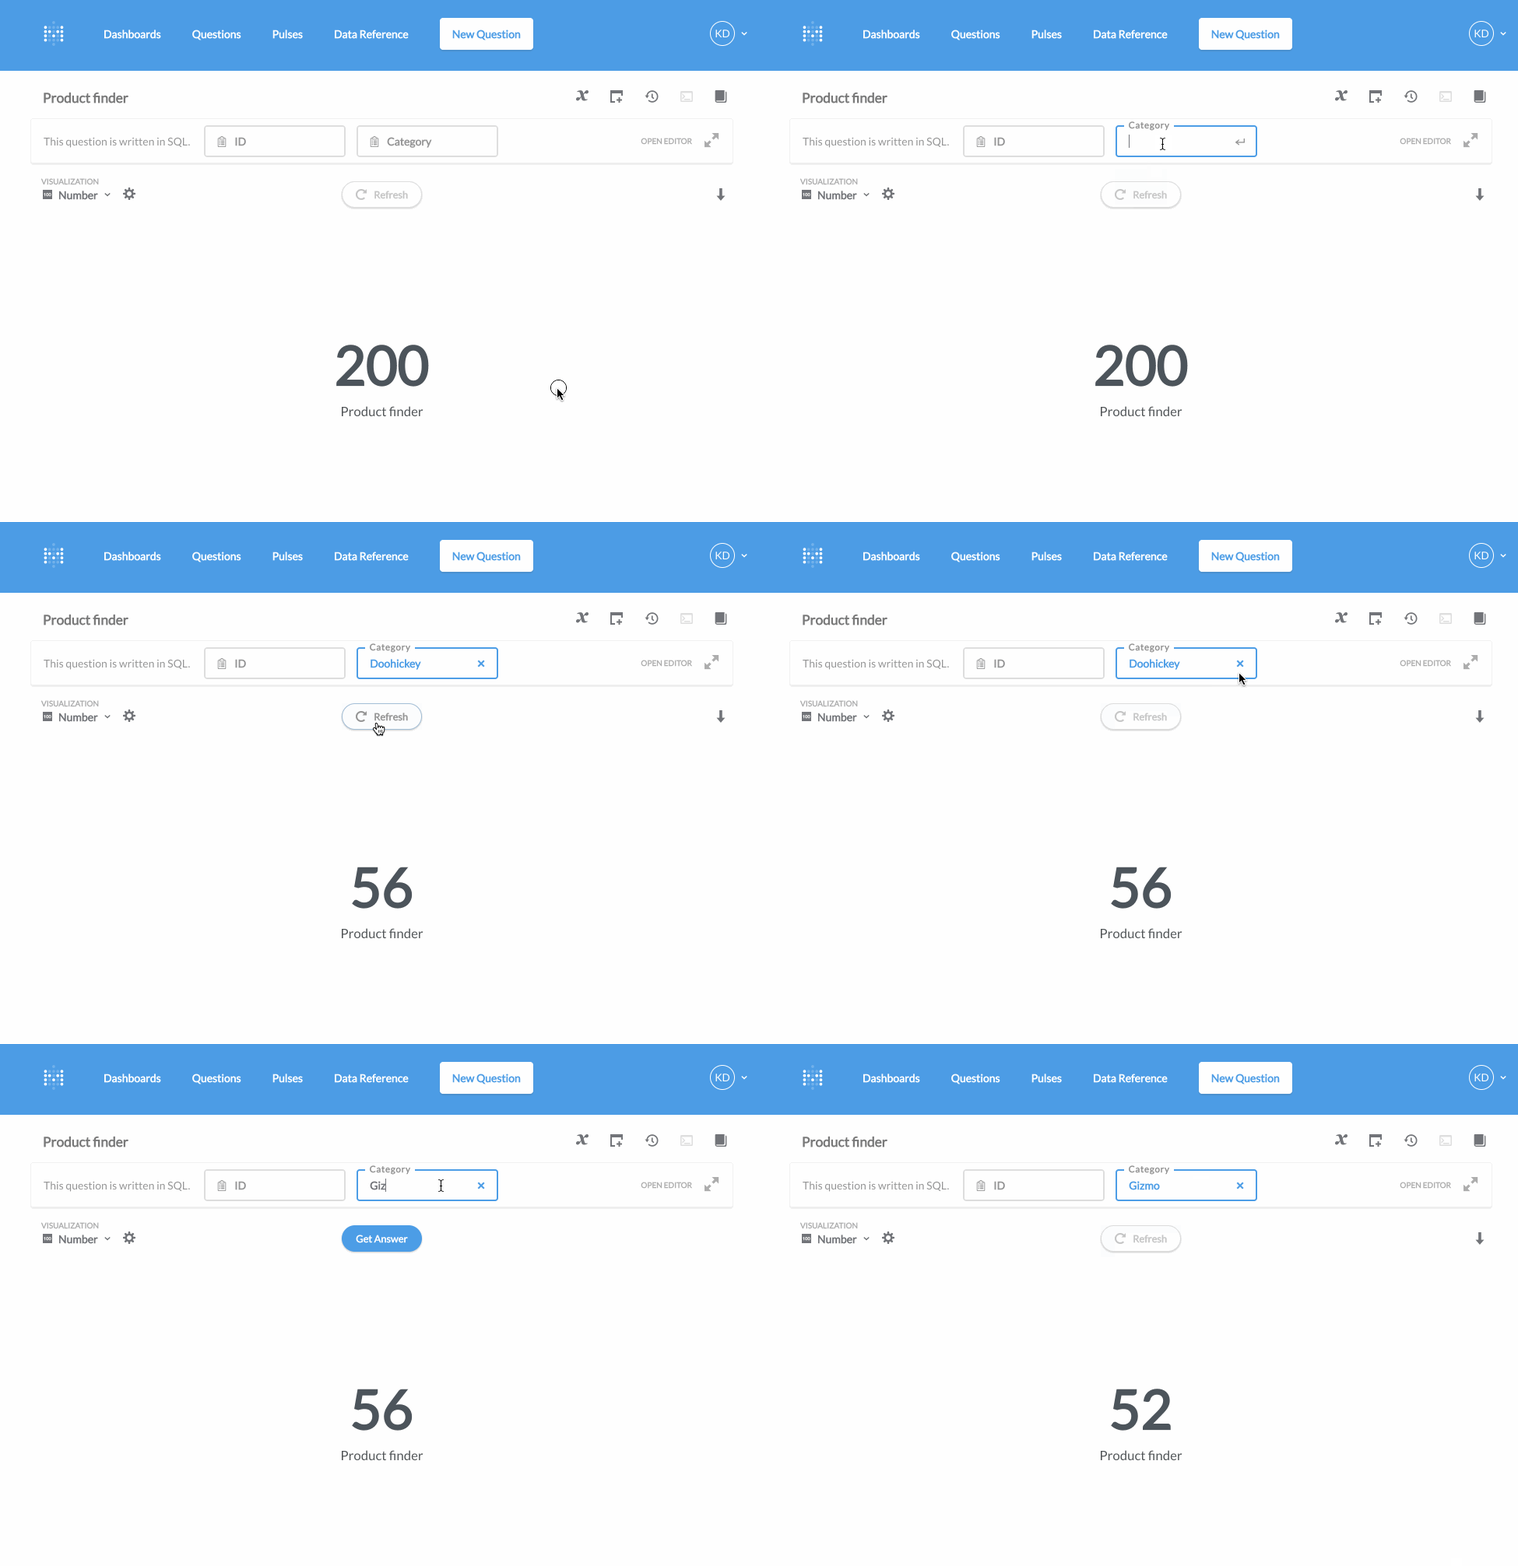
For questions that are not quite as simple, analysts and engineers can run SQL questions as well.
Once a question has been added to Metabase anyone with access can easily re-run it, tweak it, and share it.

Metabase is open source, installs in minutes and works with a wide variety of databases including MySQL, PostgreSQL and Redshift. You can run it in your own AWS account. No one else needs to see your data and you can lock things down to your heart’s content.
What kinds of questions?
If you’ve been involved with analytics, you’ve probably jumped 10 steps ahead and are thinking about all the complicated things that need to get measured. We’re not talking about multi-channel attribution, inventory forecasting, demand curve generation or fine grained Life Time Value or Cost of Acquiring a Customer. (At least not yet).
Instead we want to draw attention to what can only be called the Dark Matter of analytics. These are the questions that typically make up 90% of the query volume at most companies that no one ever brings up in a blog post Which blog posts got the most views? How many reservations do we have for next Tuesday? Which accounts are up for renewal next month? Did John Doe have any credit card chargebacks when he opened this support case? How many 5 star reviews does the average merchant have on our site?
While some subset of these tend to be built into your product, most aren’t. For all the glamor that top down KPIs and data science get, it is the answers to these micro-questions throughout the day that make everyone in your company better informed, more aware of context and more efficient in their day to day jobs.
Why now, can’t you see I’m busy?
Even before you think you need a Business Intelligence application or a data science stack, there are lots of little places where widespread access to data helps.
As you build your application, it is useful to have a place to allow restricted access to the databases in your application.
You can double check staging environment data, perform quick checks on production databases to verify that things look right, and create quick and dirty dashboards to see how things are working or not working.
Create canary cards for data integrity issues. “Is the new invite code system properly marking invite codes as used?”
As you release new versions, you might create dashboards that measure activity in those features. Rather than guessing, or hoping some of your core metrics move, you can easily instrument new changes. Eg “How many invite codes got redeemed within 24 hours of being sent?”
During launch, Metabase lets you flexibly define and redefine metrics, reports and dashboards. By providing a simple interface on top of your data, it allows anyone to modify reports and keep tabs on the data they need without having to route it through engineers or analysts.

At some point, you’ll start solidifying the things you measure (and if you’re a certain kind of person, might even call them KPIs). The dashboards that each team needs will have taken shape, and it becomes time to prune the reports that aren’t useful any more. You’ll have built up a BI and reporting system incrementally, and in response to actual day to day questions. If you were blessed with a specific kind of constructive laziness, you might have even laid down the groundwork (aka SQL views and ETL) to let your end users create their own, and leave you to more interesting work.
Out of the box, Metabase lets your coworkers run simple queries on their own. As your needs grow, you annotate and customize the data model we generate, create metrics, segments and SQL views to capture exactly the things you want to measure.
How can I try Metabase out?
Add your RDS and Redshift Databases, make some basic groups to control who gets access to which databases, and start inviting people.
As you build up a stockpile of common questions, create some collections and dashboards. At some point, you’ll need to create SQL Views for people to not have to deal with the underlying data model. Move organically and in response to demands from users.
You might also enjoy
All posts Feb 26, 2024 in Using Metabase
Embed a Metabase dashboard in Zendesk
Get the customer data and insights you need automatically filtered and ready for use within your support tickets. You can also embed a dashboard in Salesforce, Stripe, Jira, or platforms that allow embedding URLs.
Ignacio Beines Furcada and Sarina Bloodgood
‧
5 min read


