

Article
How to run Metabase in production
If you're self-hosting Metabase, here are some benchmarks and best practices.
This article describes what a production-ready setup of Metabase looks like, including server sizing, best practices, and pitfalls to avoid. This article is for people who are interested in self-hosting Metabase. If you want us to run Metabase for you, just sign up for a free trial.
- What’s in the Metabase JAR
- A JAR and a database are all you need
- Why you need to use a separate application database
- If you’ve already started using the default H2 database
- Metabase application and database servers and their sizing
- Each Metabase environment must have its own dedicated application database
- Maintenance
- Example load test
- Async processes
- Observability and some metrics to keep an eye on
- Using a load balancer
- Logs
- Metabase over HTTPS
- Pitfalls to avoid
What’s in the Metabase JAR
For context, Metabase is a web application. Its backend is written in Clojure, and its frontend is written in JavaScript, Typescript, and Clojurescript using the React framework.
By default, the entire application is self contained: the backend and the web server that serves the frontend are shipped in the same bundle. The bundle is a JAR file, which can be run anywhere a Java runtime environment is installed.
Metabase also ships a Docker container that packages up the JRE and Metabase JAR (which you can also run with Podman).
A JAR and a database are all you need
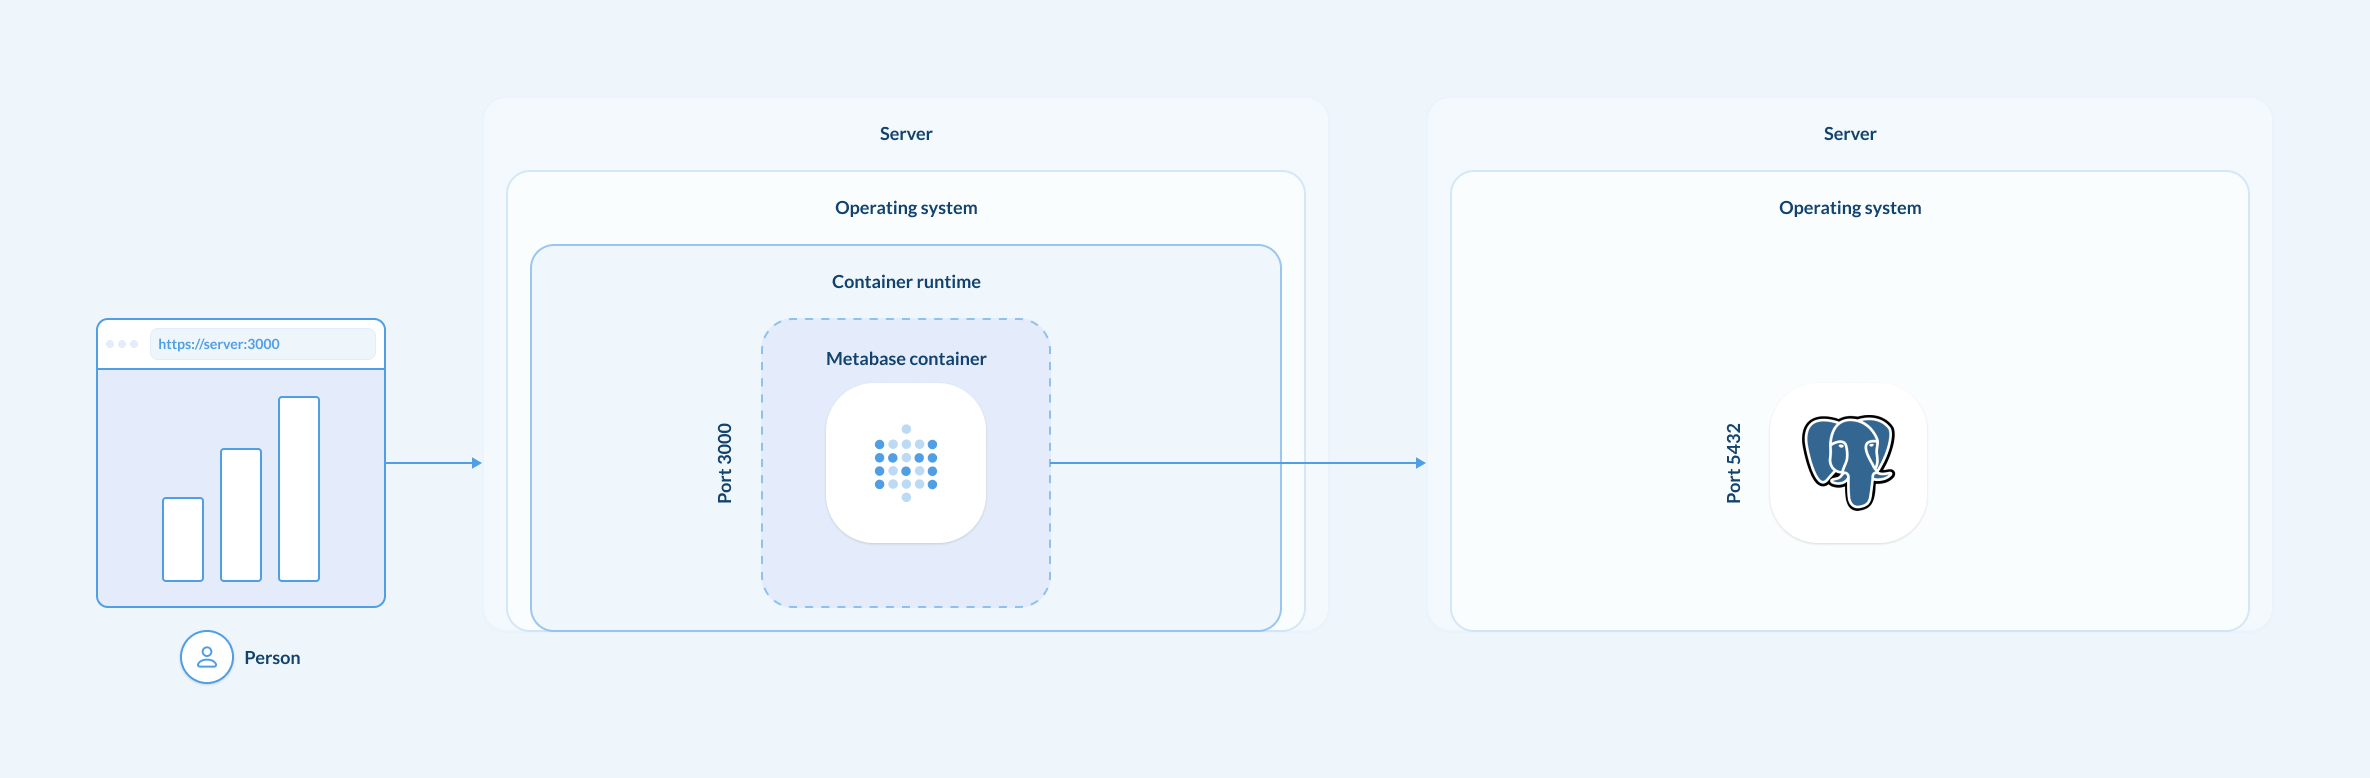
To run Metabase in production, you need two things:
- Either a Metabase JAR or the Docker image.
- A dedicated PostgreSQL database to store Metabase’s application database
You can also use MySQL/MariaDB to store Metabase’s application database, but only use MySQL if you’re more familiar with MySQL than you are with PostgreSQL.
Why you need to use a separate application database
Metabase saves all its entities (dashboards, questions, accounts, configurations) in its application database.
If you stick with the default, file-based application database, your database will eventually become irrevocably corrupted, and you’ll have to start over from scratch (after losing all your work: all of your questions, dashboards, and so on)**.
So the one thing you want to avoid doing is using the default application database that ships with the Metabase JAR. That embedded database is intended for local use only. We include that embedded database as a kind of party favor for people who just want to try out Metabase on their machine. That embedded H2 database also houses some sample data that people can play with. It’s NOT meant for production.
Similarly, if you’re running Metabase in a container, you’ll lose your all of your work whenever your container is replaced with a new version. Containers are meant to be ephemeral, so don’t keep your data inside them.
You can avoid all of these problems by using a dedicated PostgreSQL application database.
If you’ve already started using the default H2 database
That’s okay. But you should migrate to a production database as soon as possible.
Metabase application and database servers and their sizing
We recommend that you run at least two instances (ideally on the same network):
- One or more instance for the Metabase application.
- One database instance for the Postgres or MySQL Metabase application database where Metabase will store its application data. We recommend that the database instance not be used for any other purpose than the Metabase application database.
The reason you want to run these instances on the same network is to reduce the time it takes for Metabase (the application) to get a response from the database storing its application data. The vast majority of Metabase operations require a call to Metabase’s API, which uses the application database to retrieve information about questions, dashboard, table metadata, and so on.
Metabase application server size
For every 20 concurrent people using your Metabase, Metabase will need 1 CPU and 1GB of RAM. These system recommendations apply whether you’re running Metabase as a JAR or as a Docker container.
Metabase application database server size
The application database is probably the most important component of the entire architecture: it’s the single point of failure, and the faster the app db can return queries to the Metabase application server, the better. As a starting point, allocate 1 CPU core and 2GB of RAM the server running your application database. As a general rule, for every 40 concurrent people using your Metabase, a PostgreSQL application database will need 1 CPU core and 1 GB of RAM.
Each Metabase environment must have its own dedicated application database
By environment, we mean one or more Metabase jars (or Docker images), and one application database. If you’re running multiple environments, you can run multiple application databases, one for each environment, on the same application database server, but each environment must have its own dedicated application database.
Maintenance
Keeping things running smoothly.
- Metabase server maintenance
- Metabase application database maintenance
- Data warehouse server maintenance
Metabase server maintenance
You don’t need to do anything. It should just work.
Metabase application database maintenance
All databases require maintenance for optimal performance, and PostgreSQL and MySQL are no exception. Follow PostgreSQL’s best practices for maintenance(https://www.postgresql.org/docs/current/maintenance.html) (especially backups:
This application database should be:
- Backed up on a daily basis.
- Vacuumed and analyzed on a weekly basis.
Additionally, cards and dashboards that are no longer needed should be periodically archived and deleted.
Data warehouse server maintenance
Maintenance of your data warehouse depends on which data warehouse you’re using. See the database’s documentation for guidance.
Example load test
On this simple load test, the Metabase API achieved the following metrics on K6:
checks.........................: 100.00% ✓ 237963     ✗ 0
data_received..................: 16 GB   7.1 MB/s
data_sent......................: 119 MB  52 kB/s
http_req_blocked...............: avg=4.19µs  min=559ns  med=3.5µs   max=37.63ms  p(90)=5.9µs   p(95)=7.2µs
http_req_connecting............: avg=211ns   min=0s     med=0s      max=37.55ms  p(90)=0s      p(95)=0s
http_req_duration..............: avg=41ms    min=1.21ms med=20.28ms max=8.1s     p(90)=84.22ms p(95)=125.62ms
 { expected_response:true }...: avg=41ms    min=1.21ms med=20.28ms max=8.1s     p(90)=84.22ms p(95)=125.62ms
http_req_failed................: 0.00%   ✓ 0          ✗ 259596
http_req_receiving.............: avg=12.02ms min=8.64µs med=57.34µs max=778.49ms p(90)=41.43ms p(95)=67.33ms
http_req_sending...............: avg=17.39µs min=3.32µs med=15.13µs max=5.86ms   p(90)=26.11µs p(95)=32.59µs
http_req_tls_handshaking.......: avg=0s      min=0s     med=0s      max=0s       p(90)=0s      p(95)=0s
http_req_waiting...............: avg=28.96ms min=1.18ms med=14.86ms max=8.1s     p(90)=61.91ms p(95)=84.26ms
http_reqs......................: 259596  113.584624/s
iteration_duration.............: avg=18.29s  min=17.6s  med=17.81s  max=29s      p(90)=19.85s  p(95)=20.88s
iterations.....................: 7211    3.155128/s
vus............................: 1       min=1        max=100
vus_max........................: 100     min=100      max=100
For context, the test ran with Metabase v44.7 on a server with 16 cores and 4GB RAM. It was configured with the environment variable JAVA_TOOL_OPTIONS: -Xmx3584m -Xms2048m. The application database was Postgres version 15.2 with 2 cores and 4GB of RAM. No HTTPS.
Load tests can’t mimic real-life usage. Usually, people’s activity in your Metabase will generate different patterns of API calls. You’ll also have asynchronous processes running in the background. If Metabase lacks sufficient CPU resources, it will queue operations. If the queue overflows, Metabase may crash trying to recover. In which case, you’ll need to allocate more cores.
Async processes
Metabase will run asynchronous processes periodically that will use CPU and RAM depending on the amount of tables and amount of columns on your tables.
These processes are:
- sync
- scan
- fingerprinting
- field values
- model caching
- question metadata
If you see Metabase using a lot of CPU on a certain period of time, check the logs to see if Metabase is running any of these processes. If so, you can schedule these tasks to run whenever people aren’t using your Metabase.
Metabase will assign each of these tasks to a single core. If your server has four cores, the maximum number of async processes that Metabase will run is three, as one core should be available for serving people’s requests (one core should be able to serve requests to ~15 people using Metabase concurrently).
Observability and some metrics to keep an eye on
Ideally you have some alarms set up so you can take action if any of these numbers cross one of these thresholds.
Metabase application
- API Response time
- CPU: 80%-90% max
- RAM: 80% max
Metabase application database
- CPU: 90% max
- RAM: 80% max
- Disk usage: 80% max.
- Disk IOPS: Check your disk’s IOPS support. If the disk you’re using to run your app db exceeds the IOPS the disk claims to support, then your disk will queue operations, which will affect performance.
When to increase the connection pool size
By default, Metabase’s connection pool size is 15 connections. To handle more people using your Metabase concurrently, you can use the MB_APPLICATION_DB_MAX_CONNECTION_POOL_SIZE environment variable to set a higher value. But more connections will require more RAM in the application database, so you’ll need to monitor RAM usage. If the database lacks free RAM, the database will try to queue connections, and some people will find Metabase unresponsive while it waits for RAM to free up.
Metabase only uses the connections it needs at any given time. But some requests can tie up many of these connections. For example, if someone loads a dashboard with 20 cards on it, Metabase will use its 15 available connections to retrieve results, and load the remaining five cards as connections become available.
Using a load balancer
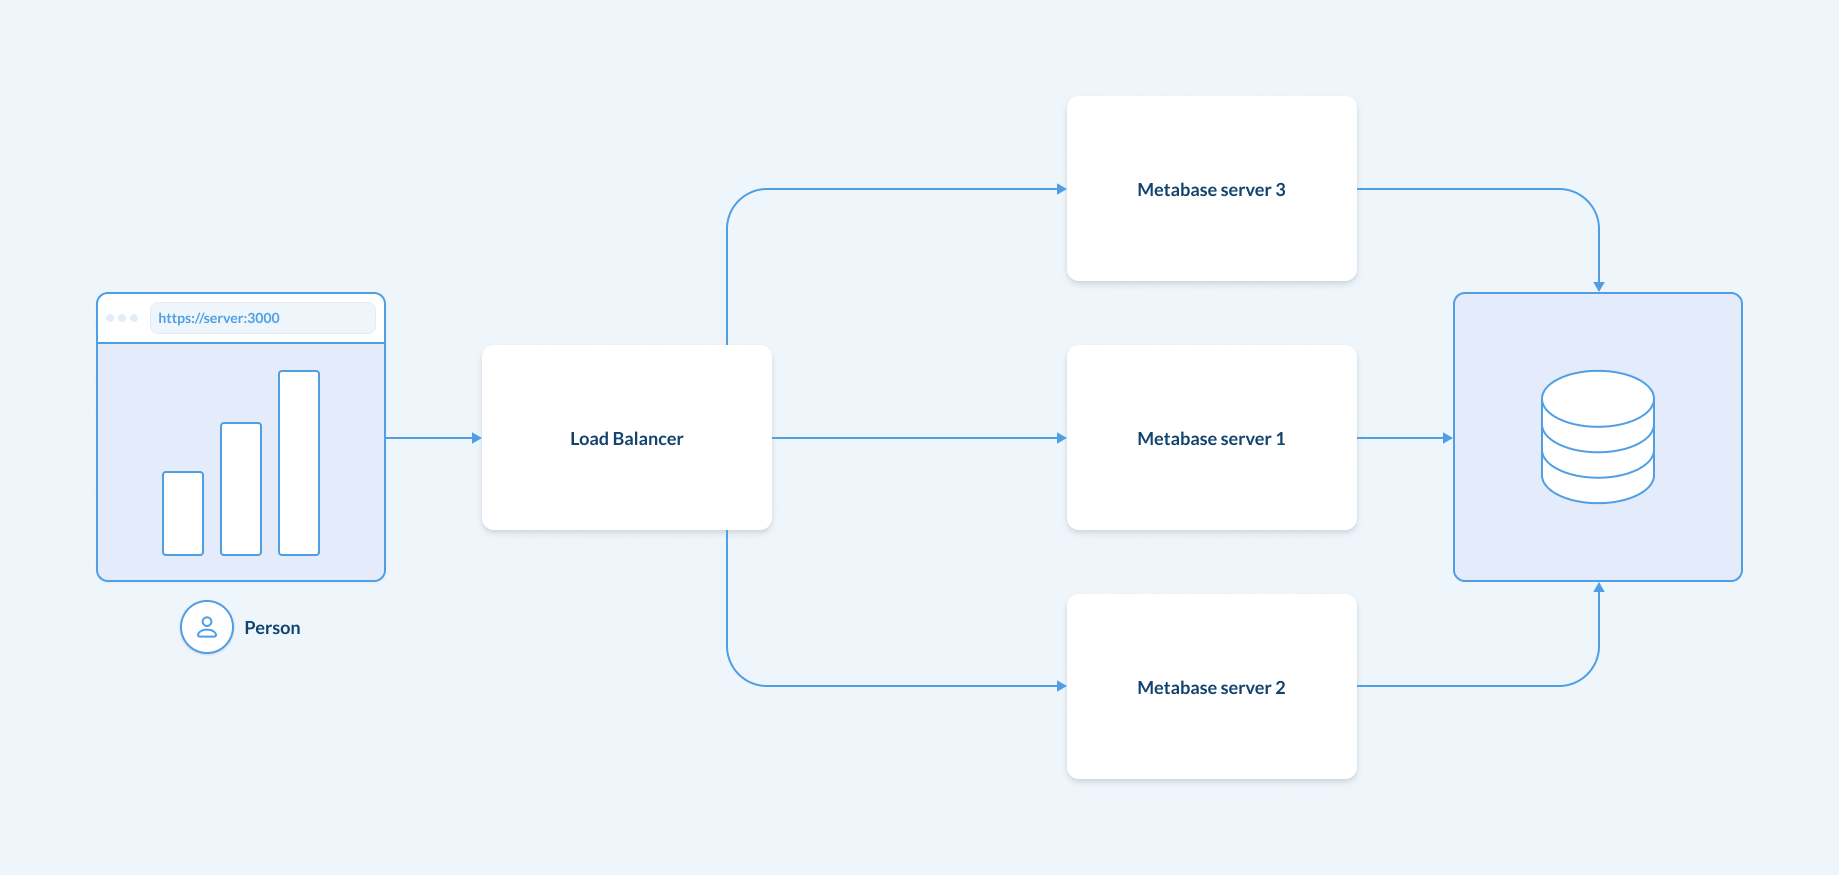
A good architectural practice is to use a load balancer on top of Metabase, even if you only have one server running, and you’re not doing any horizontal scaling. Deploying a load balancer later can be trickier to implement, and the load balancer can also perform TLS termination (a.k.a. encrypting and decrypting HTTP traffic), WAF (web application firewall), redirections, and other common tasks.
See Straightforward load balancing.
Logs
Metabase generates application logs that you should keep. These logs are useful for debugging and for auditing. Check out our docs on log configuration.
If you’ve also deployed a load balancer, or reverse proxy, on top of Metabase, we recommend you save those logs to a log aggregator. These logs will help you identify patterns and conduct investigations if needed.
Metabase over HTTPS
You can serve Metabase over HTTPS without using a load balancer or a reverse proxy.
Just note that if you use the same server to run both Metabase and the TLS termination (a.k.a. HTTPS), Metabase will lose valuable CPU resources that are spent on encrypting/decrypting traffic. So you may want to use a load balancer.
Pitfalls to avoid
Learn from the trials of others.
We recommend that you avoid services that claim to scale automagically
Based on our experience, many services that claim that scale to automagically are, well, not magical. We instead recommend that you put some observability metrics in place, monitor them, and make the scaling changes you need to make based on those observations, as your Metabase usage will grow as your company grows.
Avoid services that shut down servers when they’re not in use
If you must go with a auto-scaling service, avoid any service that periodically turns off servers when they’re not in use.
The reason is twofold:
- Async processes. Metabase runs some async processes, for example to get metadata for your tables, or refresh models, or get filter values. If these processes can’t run, people won’t see many of the features that Metabase offers.
- Startup time The first people to log into your application the next will will suffer a massive performance penalty, as the server will have to spin up from a complete cold start.
Issues with running on other cloud providers
Just something to be aware of: many cloud service providers will host you on shared infrastructure. In this case, tenants share access to CPUs. Multi-tenant servers can be cheaper to rent, and they can offer decent performance, provided your CPU usage stays under 100%. If your Metabase server uses 100% of CPU for a certain amount of time, the provider may throttle the performance of your assigned CPUs, and your performance will significantly degrade. The same throttling can happens with disk IOPS in shared infrastructure.