

Article
Custom expressions in the notebook editor
When you should use custom expressions and why you should take advantage of them in Metabase's notebook editor.
In mathematics, expressions are collections of symbols that together express a value. If you’ve ever worked with spreadsheet software before, expressions are formulas, like =SUM(A1, B1).
Custom expressions in Metabase’s query builder are powerful tools that can cover the vast majority of analytics use cases without the need to take SQL out of the toolbox. In fact, there are big advantages to using the query builder that you don’t get when you use SQL:
- Drill-through allows people to filter, break out, zoom in, or x-rays the data on click. Drill-through is available for questions composed in the query builder and for models based on both GUI and SQL queries — as long as you’ve set the appropriate column type metadata.
- Extensibility: Using the query builder to build queries allows those with whom you share your questions to learn from and build on your questions without needing to know any SQL.
And you can always switch to SQL at any point during your development by converting an existing simple or custom question to a native SQL question.
There are three places in the query builder where we can use custom expressions:
- Custom columns use functions to compute values (like
+to add numbers) or manipulate text (likelowerto change text to lowercase). - Custom filters use functions like
containsthat evaluate to either true or false. - Custom summaries use functions like
countorsumto aggregate records.
Custom columns
We can add a custom column to our data using an expression to compute a new column. Let’s see an expression in action. Here is the Orders table from the Sample database included with Metabase.
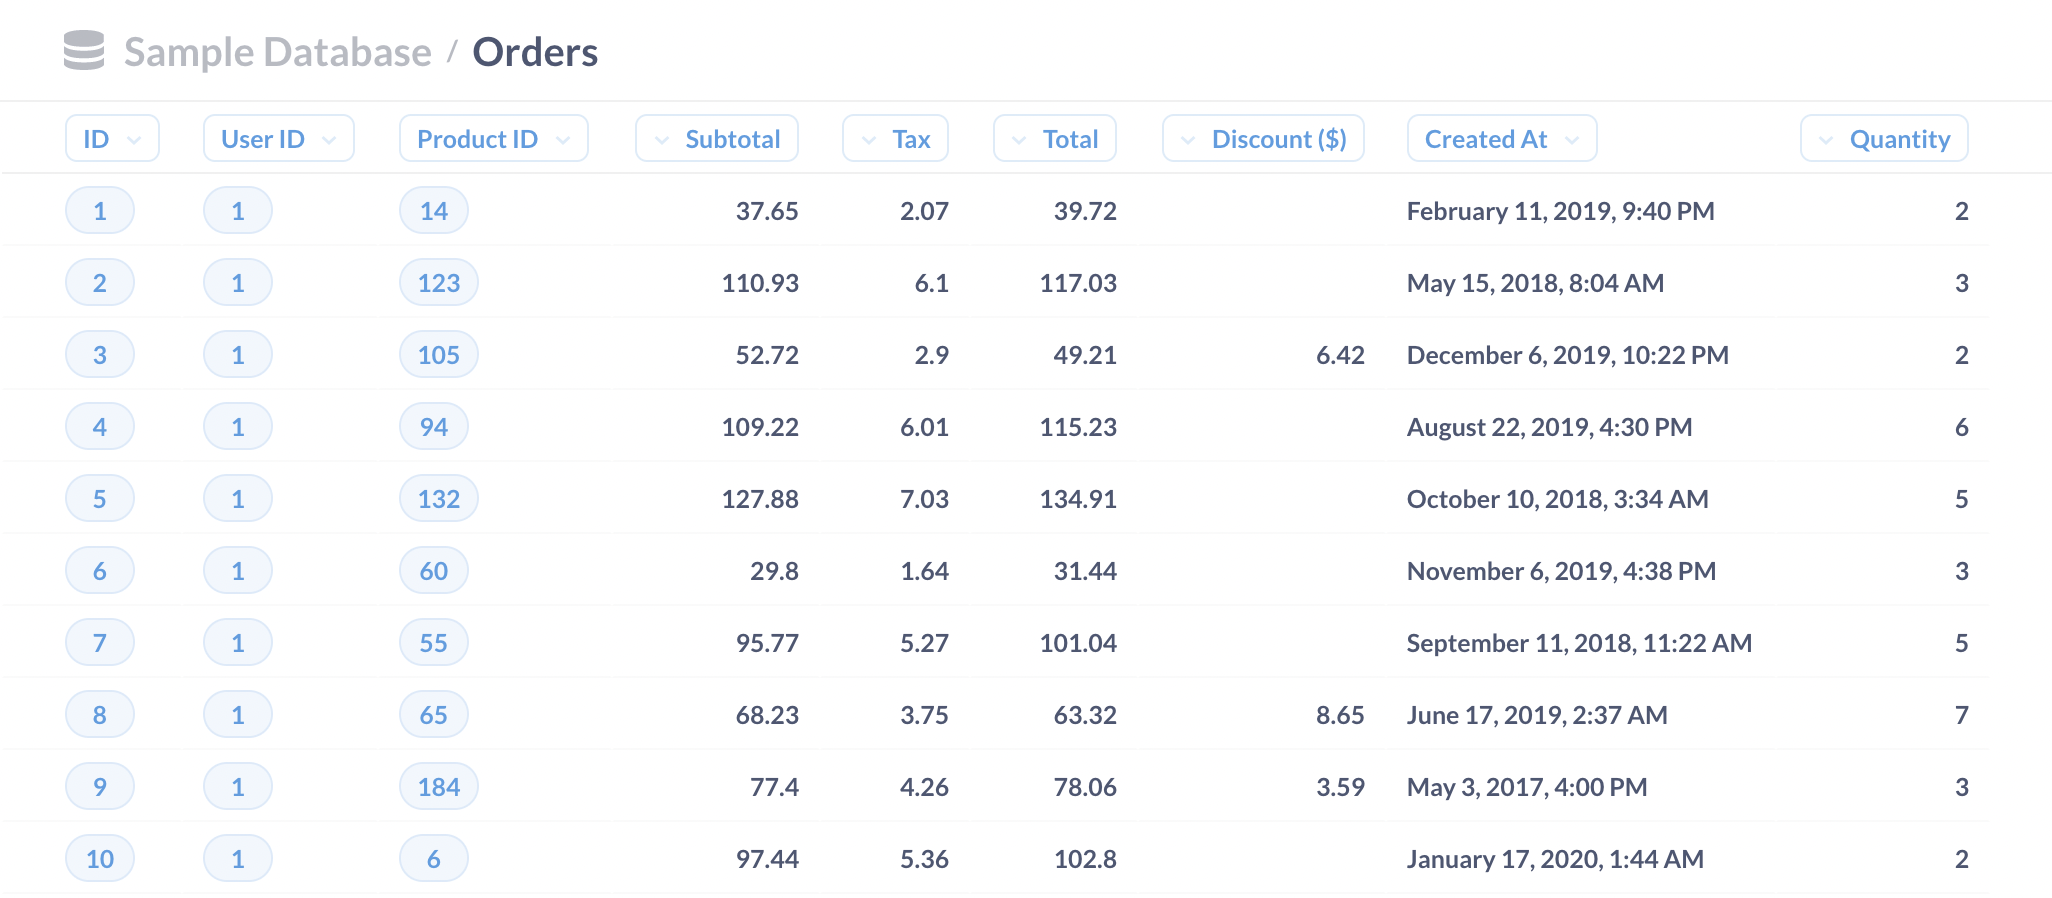
Let’s say we want to know the discount percentage applied to orders based on the pre-tax subtotal. For example, if we gave a $1 discount on a $10 order, we’d want to see a column show that we had discounted that order by 10%.
Unfortunately, a quick scan of the columns in the preview tells us that the database does not store that computation (i.e. there is no “discount percentage” column). We only have the subtotal of the order, and the discount total.
Thanks to math, however, we can use the discount total and order subtotal to compute the percentage. Here’s where expressions come into play: we can use an expression to compute the discount percentage for each row, and store that computed value in a new column.
Let’s walk through how to create a custom column.
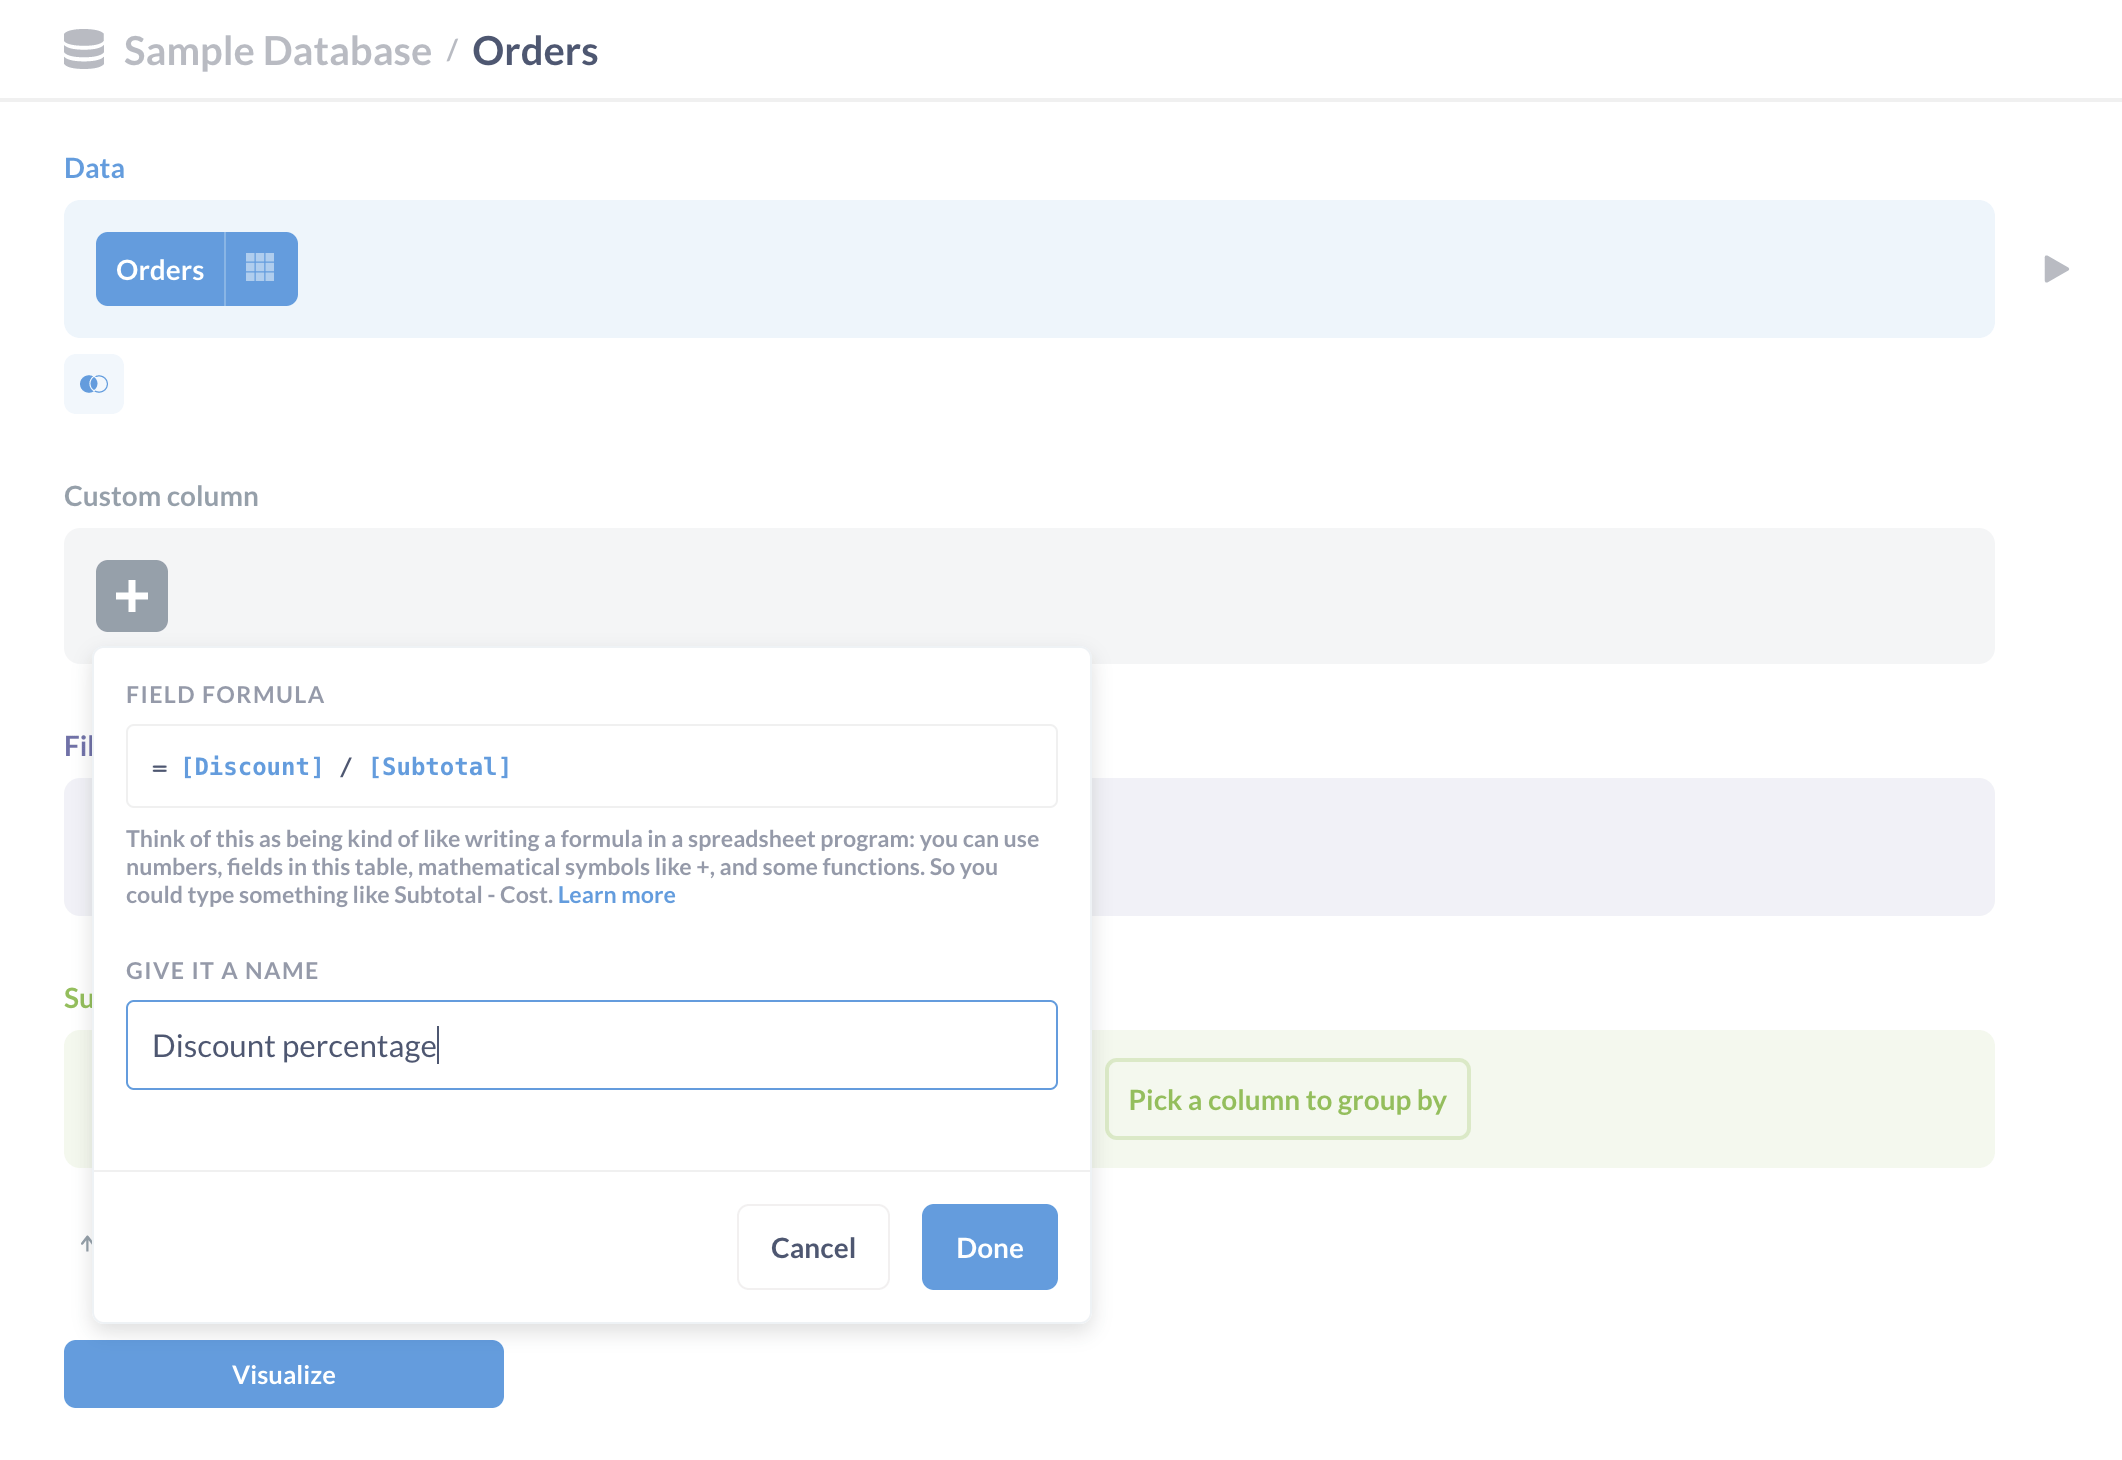
When in the notebook editor, we select Custom column in the Data section.
To calculate the discount percentage, we’ll need we’ll need to divide the discount by the original total (the Subtotal) to get the discount percentage.
In expressions, we reference columns using brackets. For example, we can refer to the Discount column in the Orders table as [Discount]. If we need to reference a column from another table linked by a foreign key, we can use a . between the table and the column, as in [Table.Column] (alternatively you can select [Table → Column] from the dropdown menu that appears when you type an open bracket ([). For example, we could enter [Products.Category] which will resolve to: [Products → Category].
For now, we’re just interested in columns in the Orders table, so there’s no need to reference another table. Here’s the expression (or formula), we’ll use to compute our custom discount percentage column:
= [Discount] / [Subtotal]
Enter that expression in the Expression field, then give the new column a name: Discount percentage.
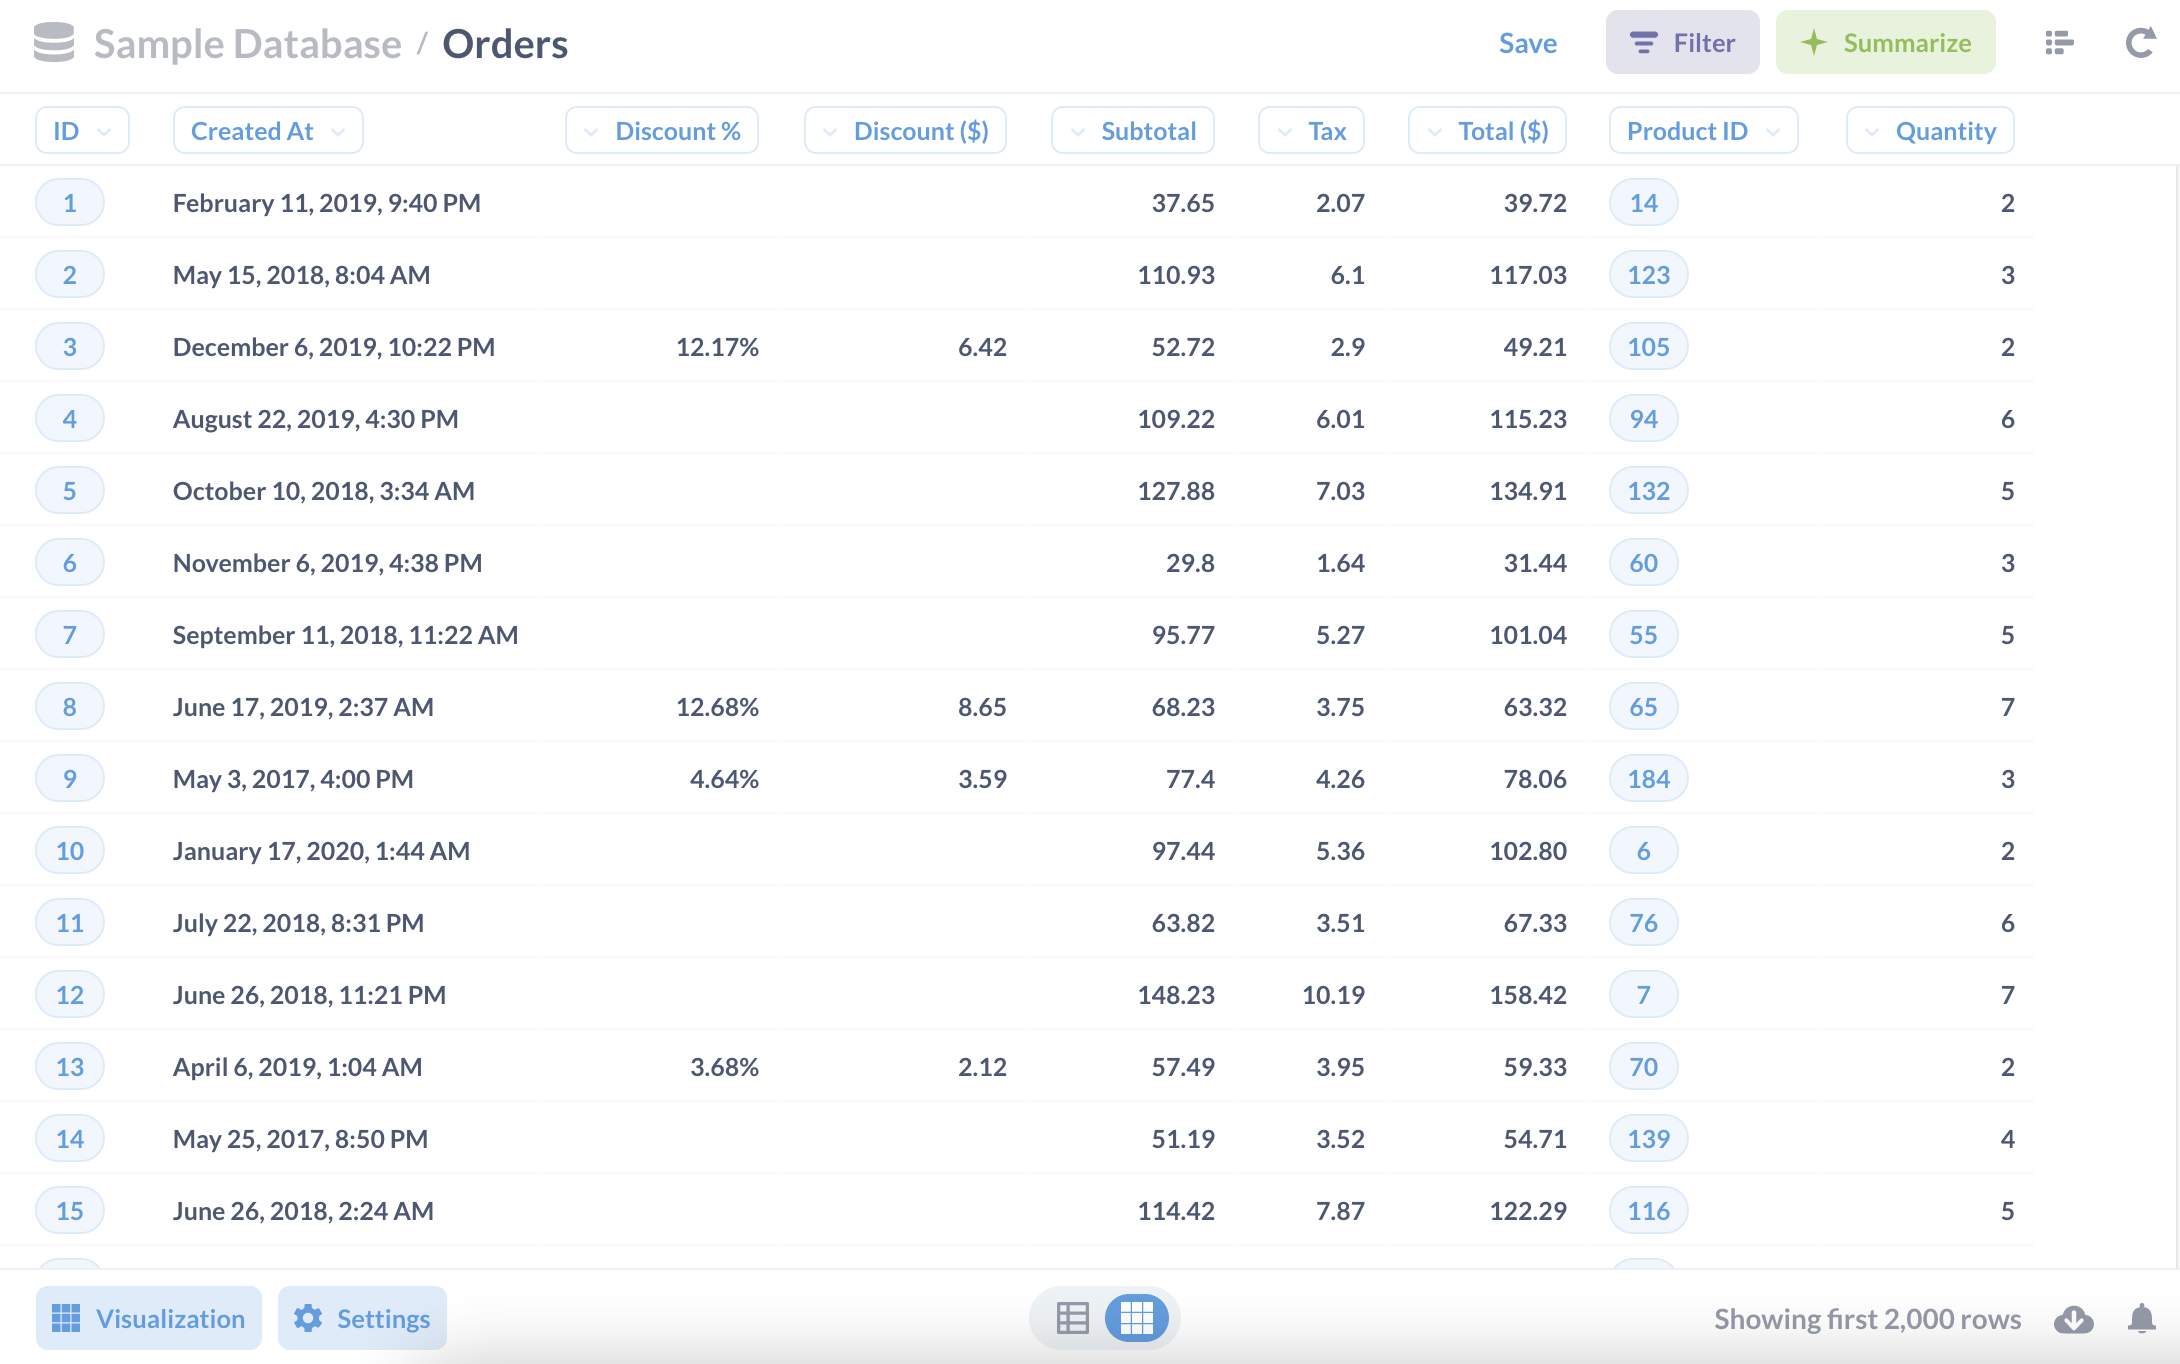
Click done, then click the Visualization button to see your new column.
Since the value in our new Discount percentage column concerns discounts, let’s move the column next to the Discount column. You can move columns around on tables by clicking on the column header and dragging the column to your target location, like so:
Since we’re computing a percentage, let’s fix the formatting so it’s easier to read. Click on the Discount percentage heading to bring up the Action Menu for the column, then click on the gears icon to format the column.
Metabase will slide out a Formatting sidebar with options. Let’s change the style to Percent, and bump up the number of decimal places to 2. And since the title Discount percentage takes up a lot of space, let’s rename the column to Discount %.
There’s an option to add a mini bar chart as well. This bar chart won’t show the percentage with respect to 100%; instead the mini bar chart will show us the discount percentage relative to the discount percentage given to other orders. Let’s leave the mini bar chart off for now.
Here’s the finished question with the added Discount % column:
Custom filters
Metabase comes with a lot of filtering options out of the box, but you can design more sophisticated filters using custom filter expressions. These are particularly useful for creating filters that use OR statements, and that’s what we’ll be covering here.
Normally in the query builder, when we add multiple filters to our question, Metabase implicitly combines the filters with an AND operator. For example, if we add a filter for products that are Enormous and a filter for products that are Aerodynamic, our question will only return products that are both Enormous AND Aerodynamic, which (enormous, aerodynamic products) do not exist in Metabase’s Sample Database.
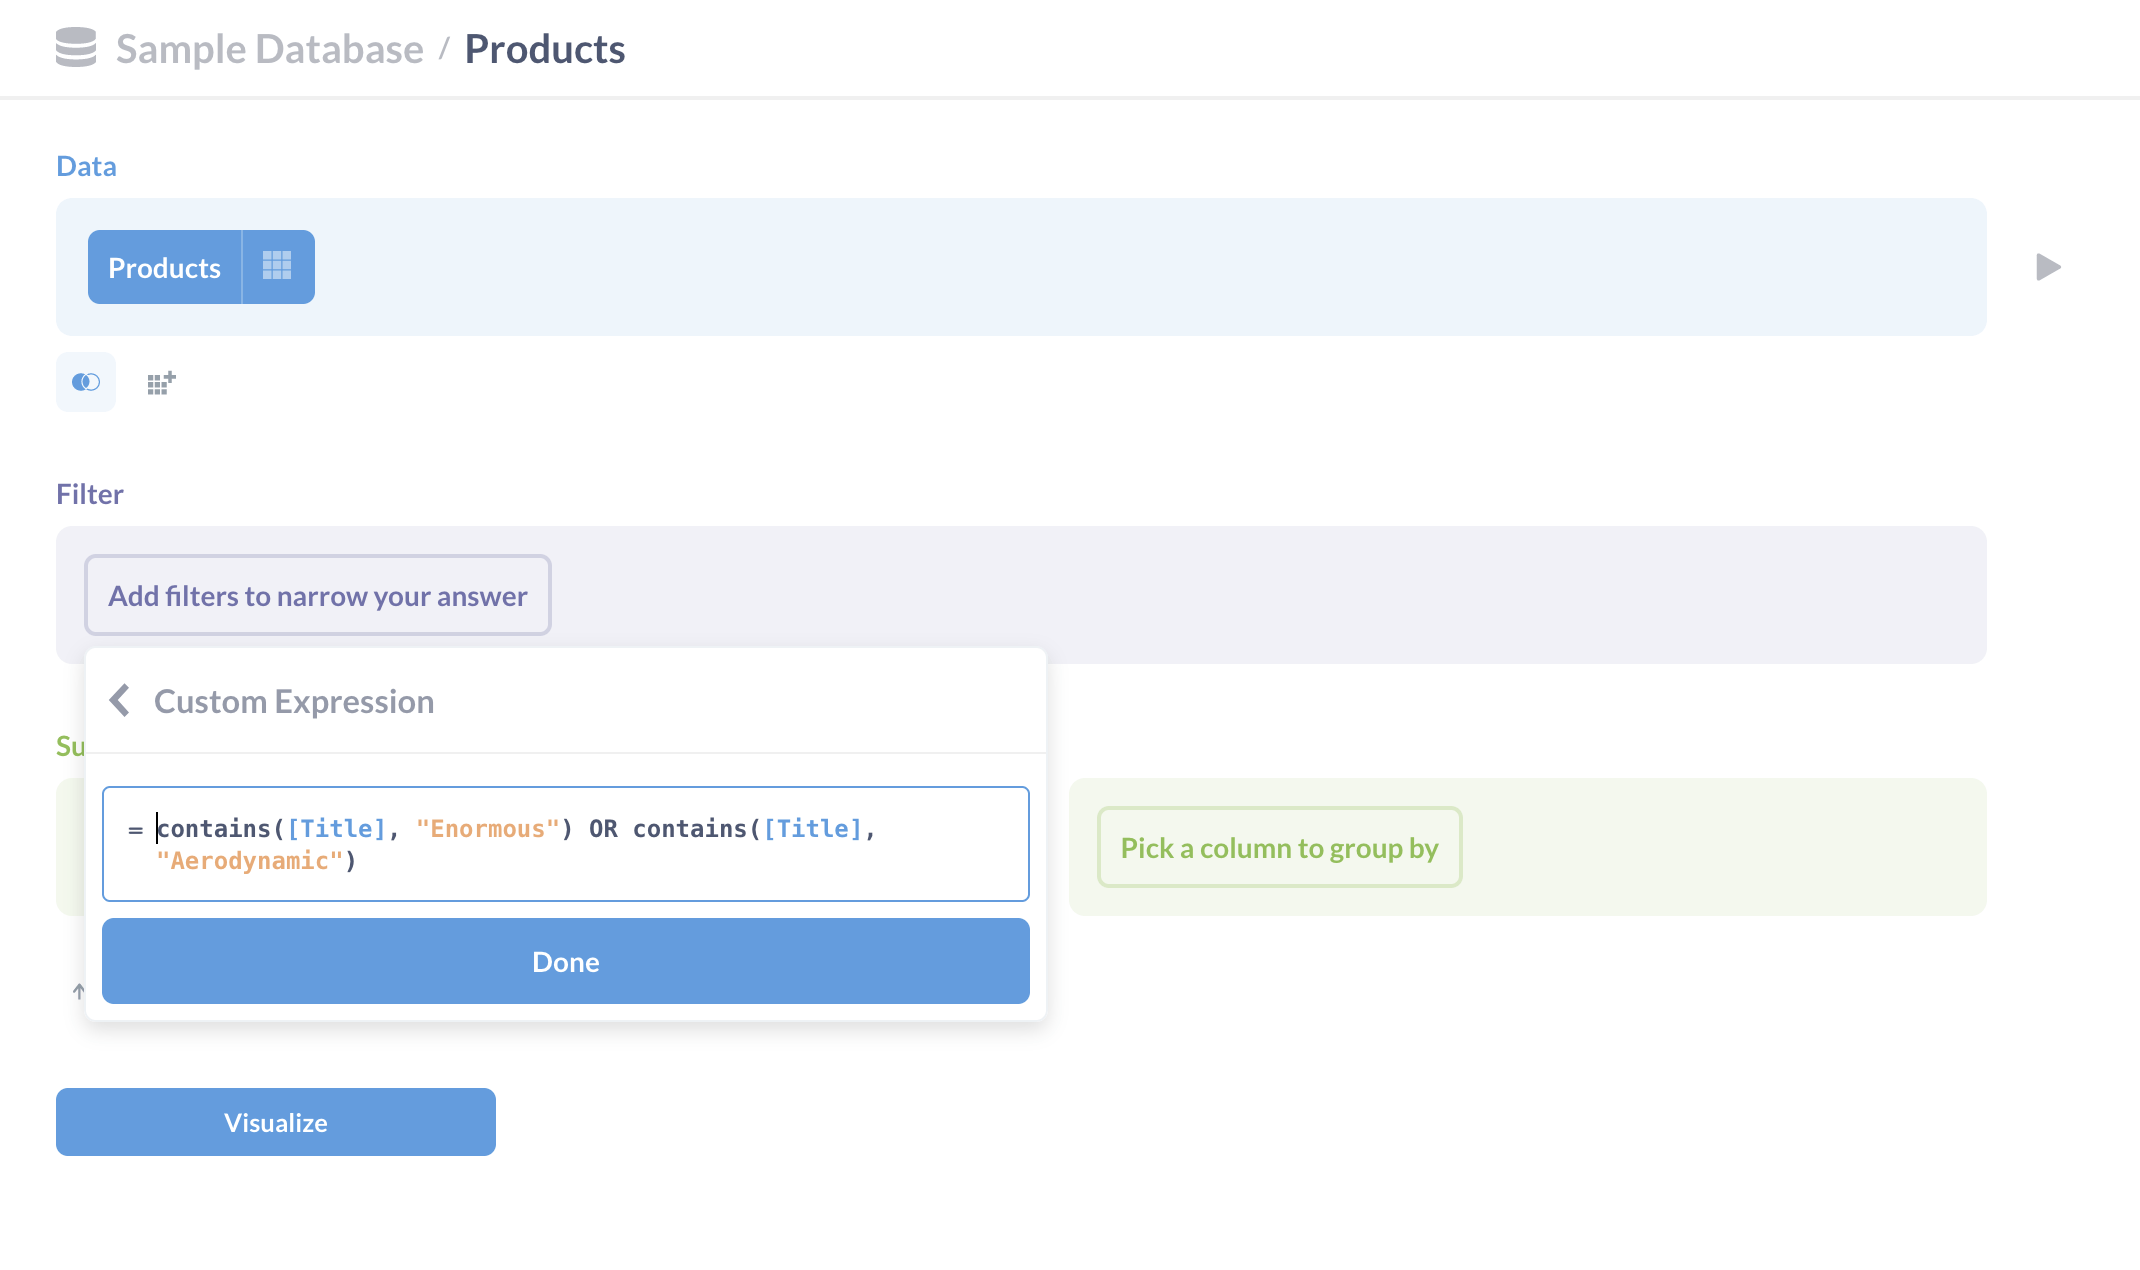
To filter for products that are either Enormous OR Aerodynamic, we’ll select Custom Expression from the Filter dropdown, and use the contains function to check if the product has either Enormous or Aerodynamic somewhere in the title.
contains(string1, string2)
contains checks to see if string1 contains string2 within it. So string1 is the string to check (the haystack), and string2 is the text to look for (the needle). And since we want to look for either Enormous or Aerodynamic products, we can write two contains expressions with an OR operator in between:
= contains([Title], "Enormous") OR contains([Title], "Aerodynamic")
The resulting data set will contain products that are either Enormous or Aerodynamic:
Note that custom filter expressions must always resolve to either true or false. In the case of the contains function used above, the expression evaluates as true if the title has either Enormous or Aerodynamic in it, otherwise the expression evaluates as false.
You can, however, nest expressions that do not resolve to true or false within statements, like:
= contains(concat([First Name], [Last Name]), "Wizard")
because the outermost function (contains) resolves to either true or false. Whereas you couldn’t use concat([First Name], [Last Name]) as a filter, as it would resolve to a string of text (though you could use concat to create a custom column like Full Name).
Custom summaries
Custom expressions unlock many different ways to aggregate our data. Let’s consider the Share function, which returns the percent of rows in the data that match the condition, as a decimal. For example, say we want to know the total percentage of paper products in our product line, i.e. what share of our product line is composed of paper products?
To start, we’ll select the Products table from the Sample Database. Next, we’ll click the Summarize button in the query builder and select Custom Expression. Then, we’ll select Share from the dropdown menu, which will prompt us for a condition. In this case, we want to know which products have “Paper” in their title, so we’ll use the contains function to search through Title.
= Share(contains([Title], "Paper"))
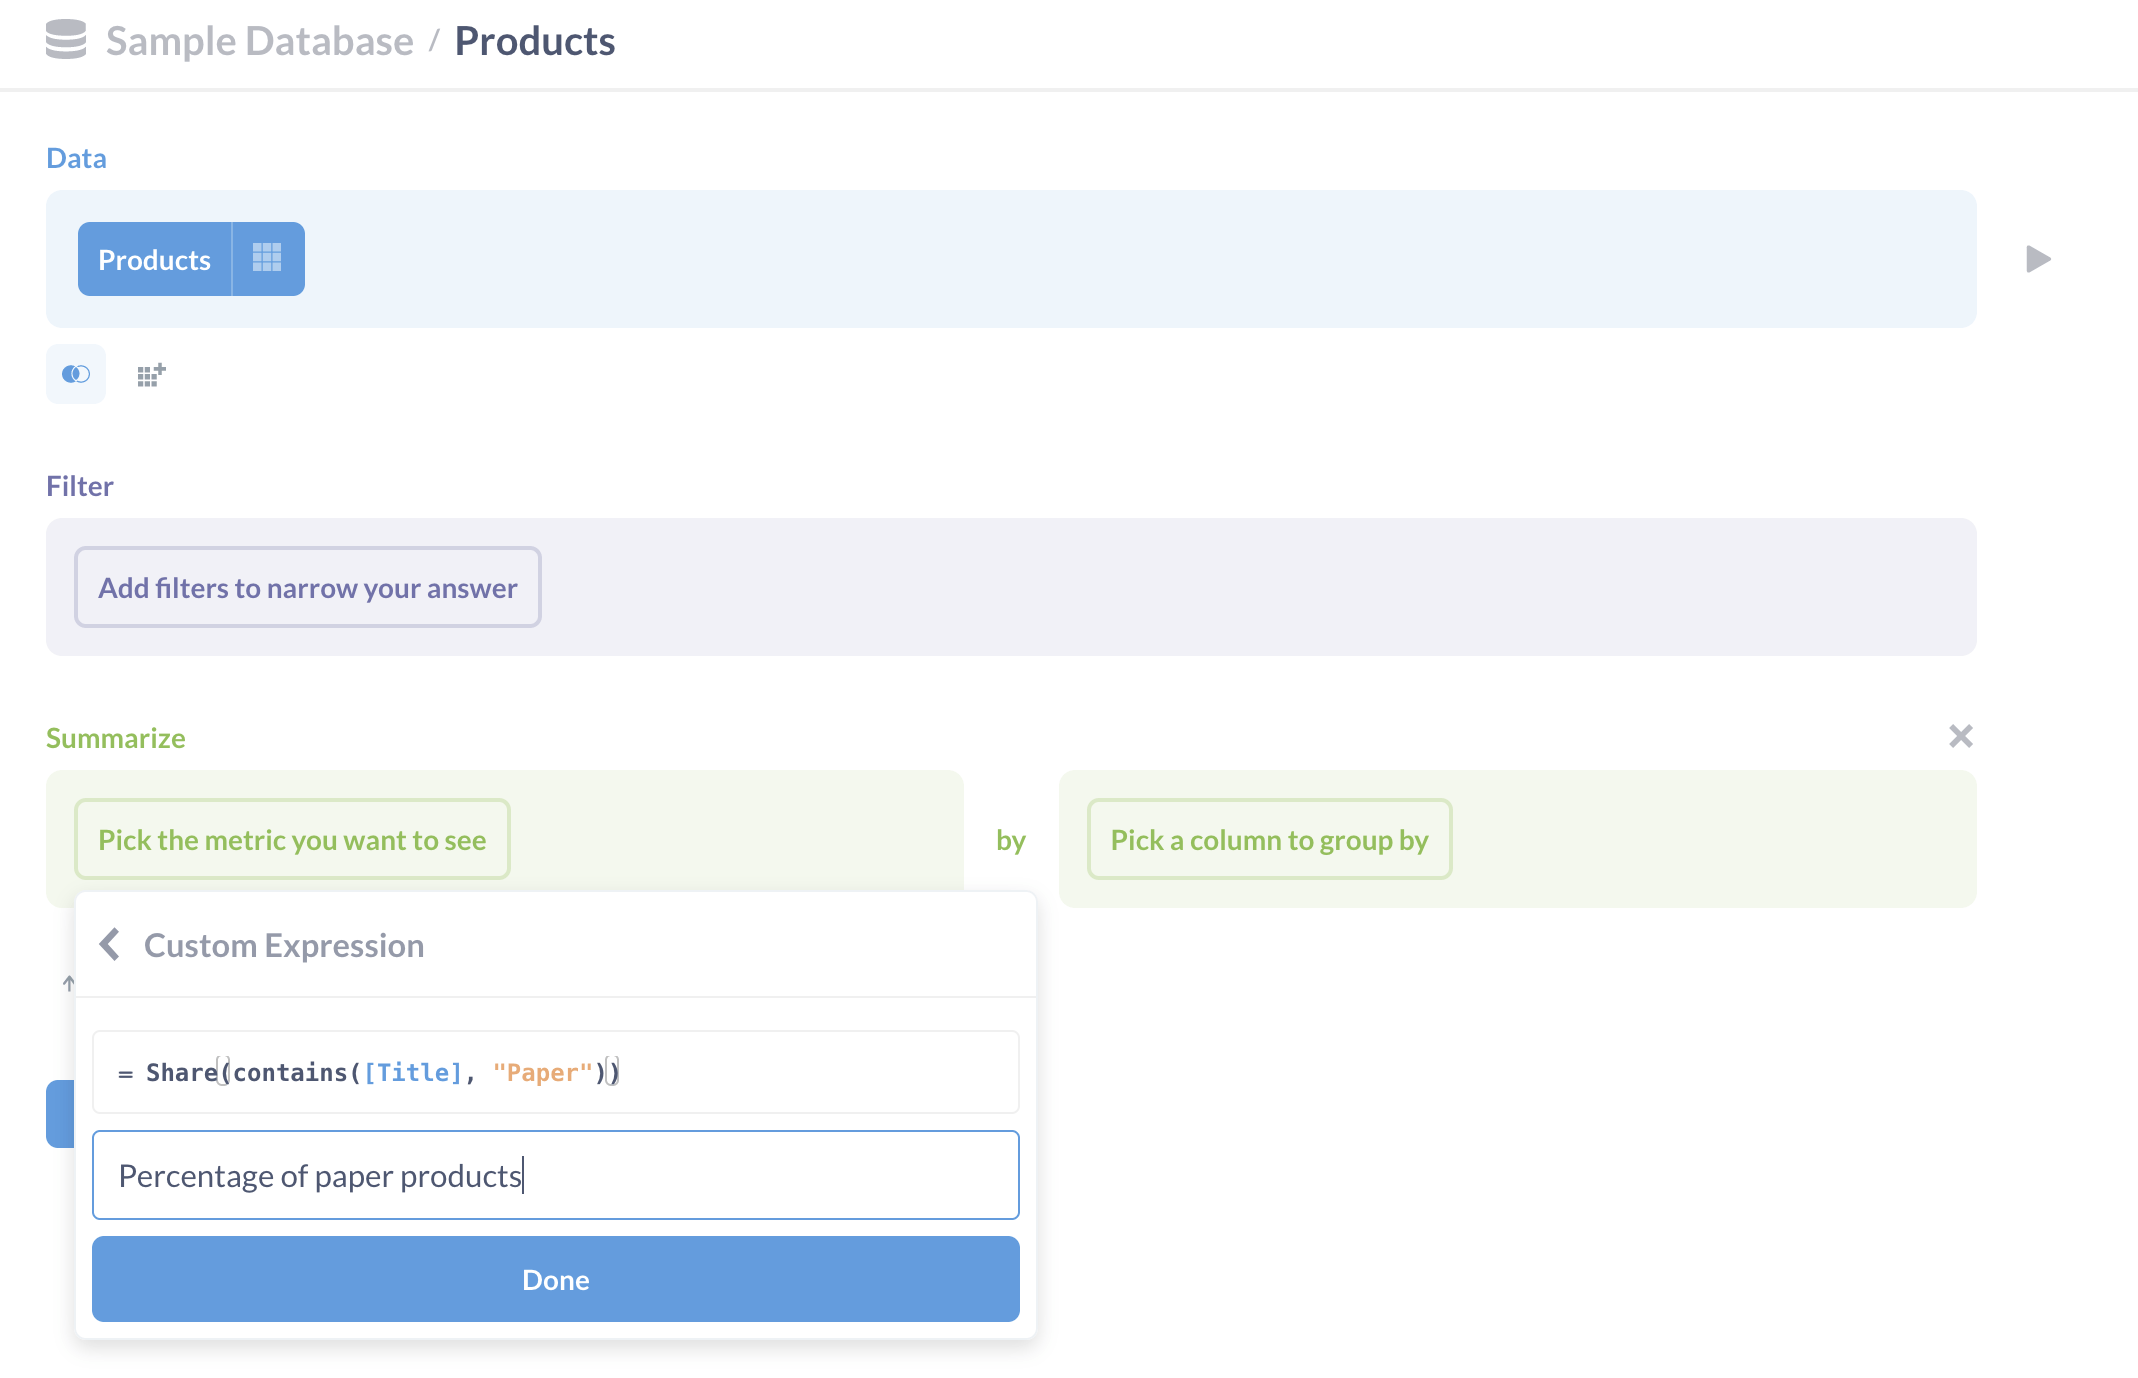
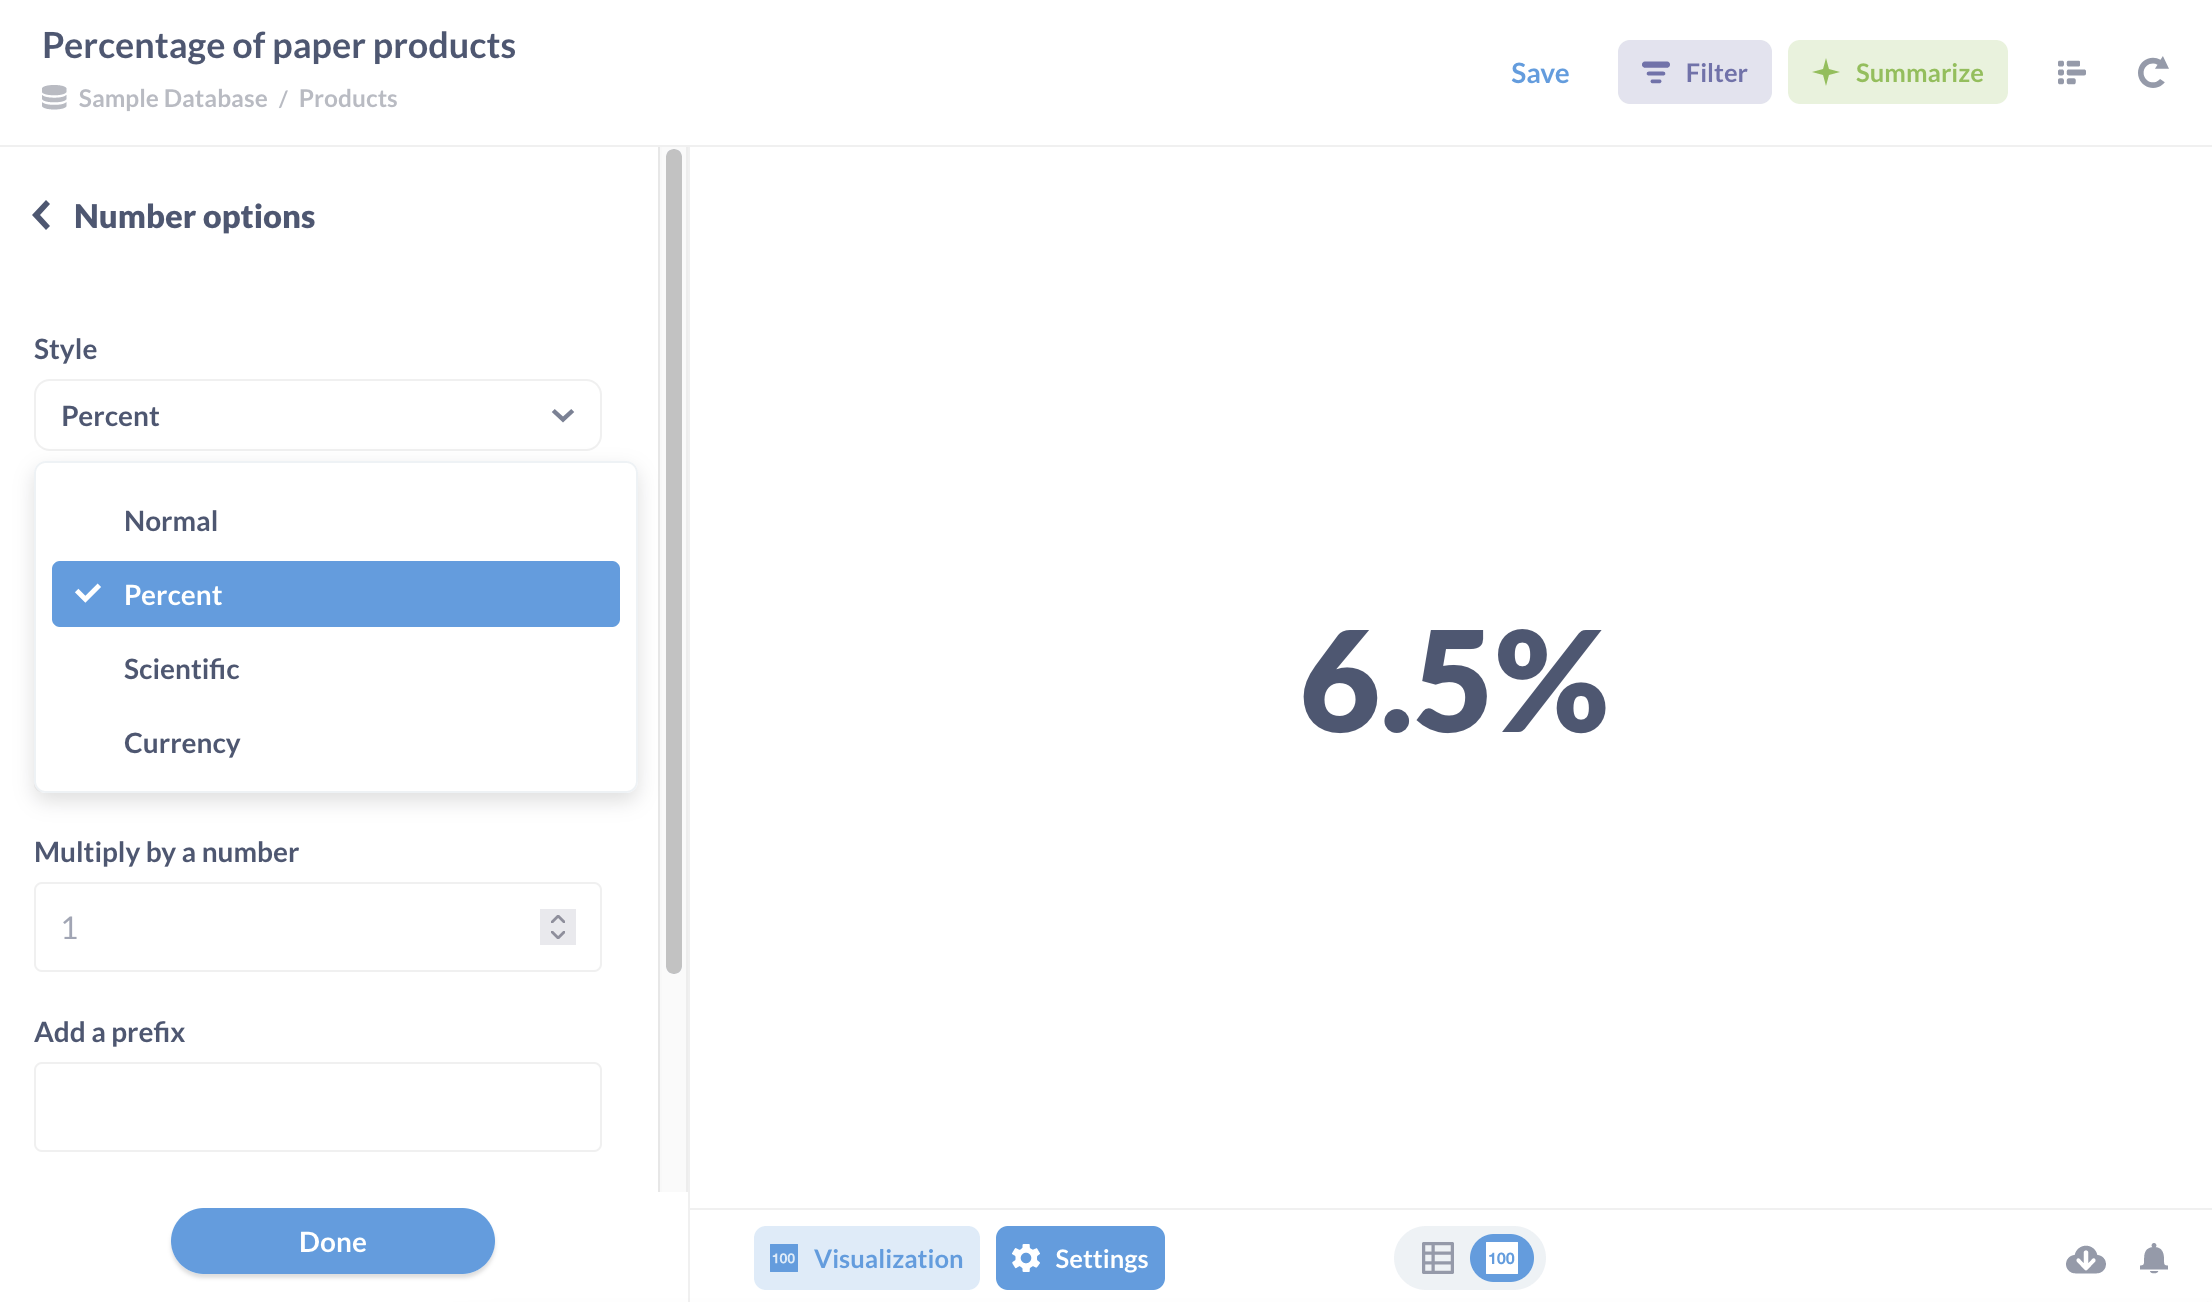
Then we name our expression (e.g., Percentage of paper products) and click Done. Click the Visualize button and Metabase will compute the share of paper products.
To change the formatting, select the Settings button in the bottom-left to bring up the Settings sidebar and change Number options → Style to Percent.
Putting it all together
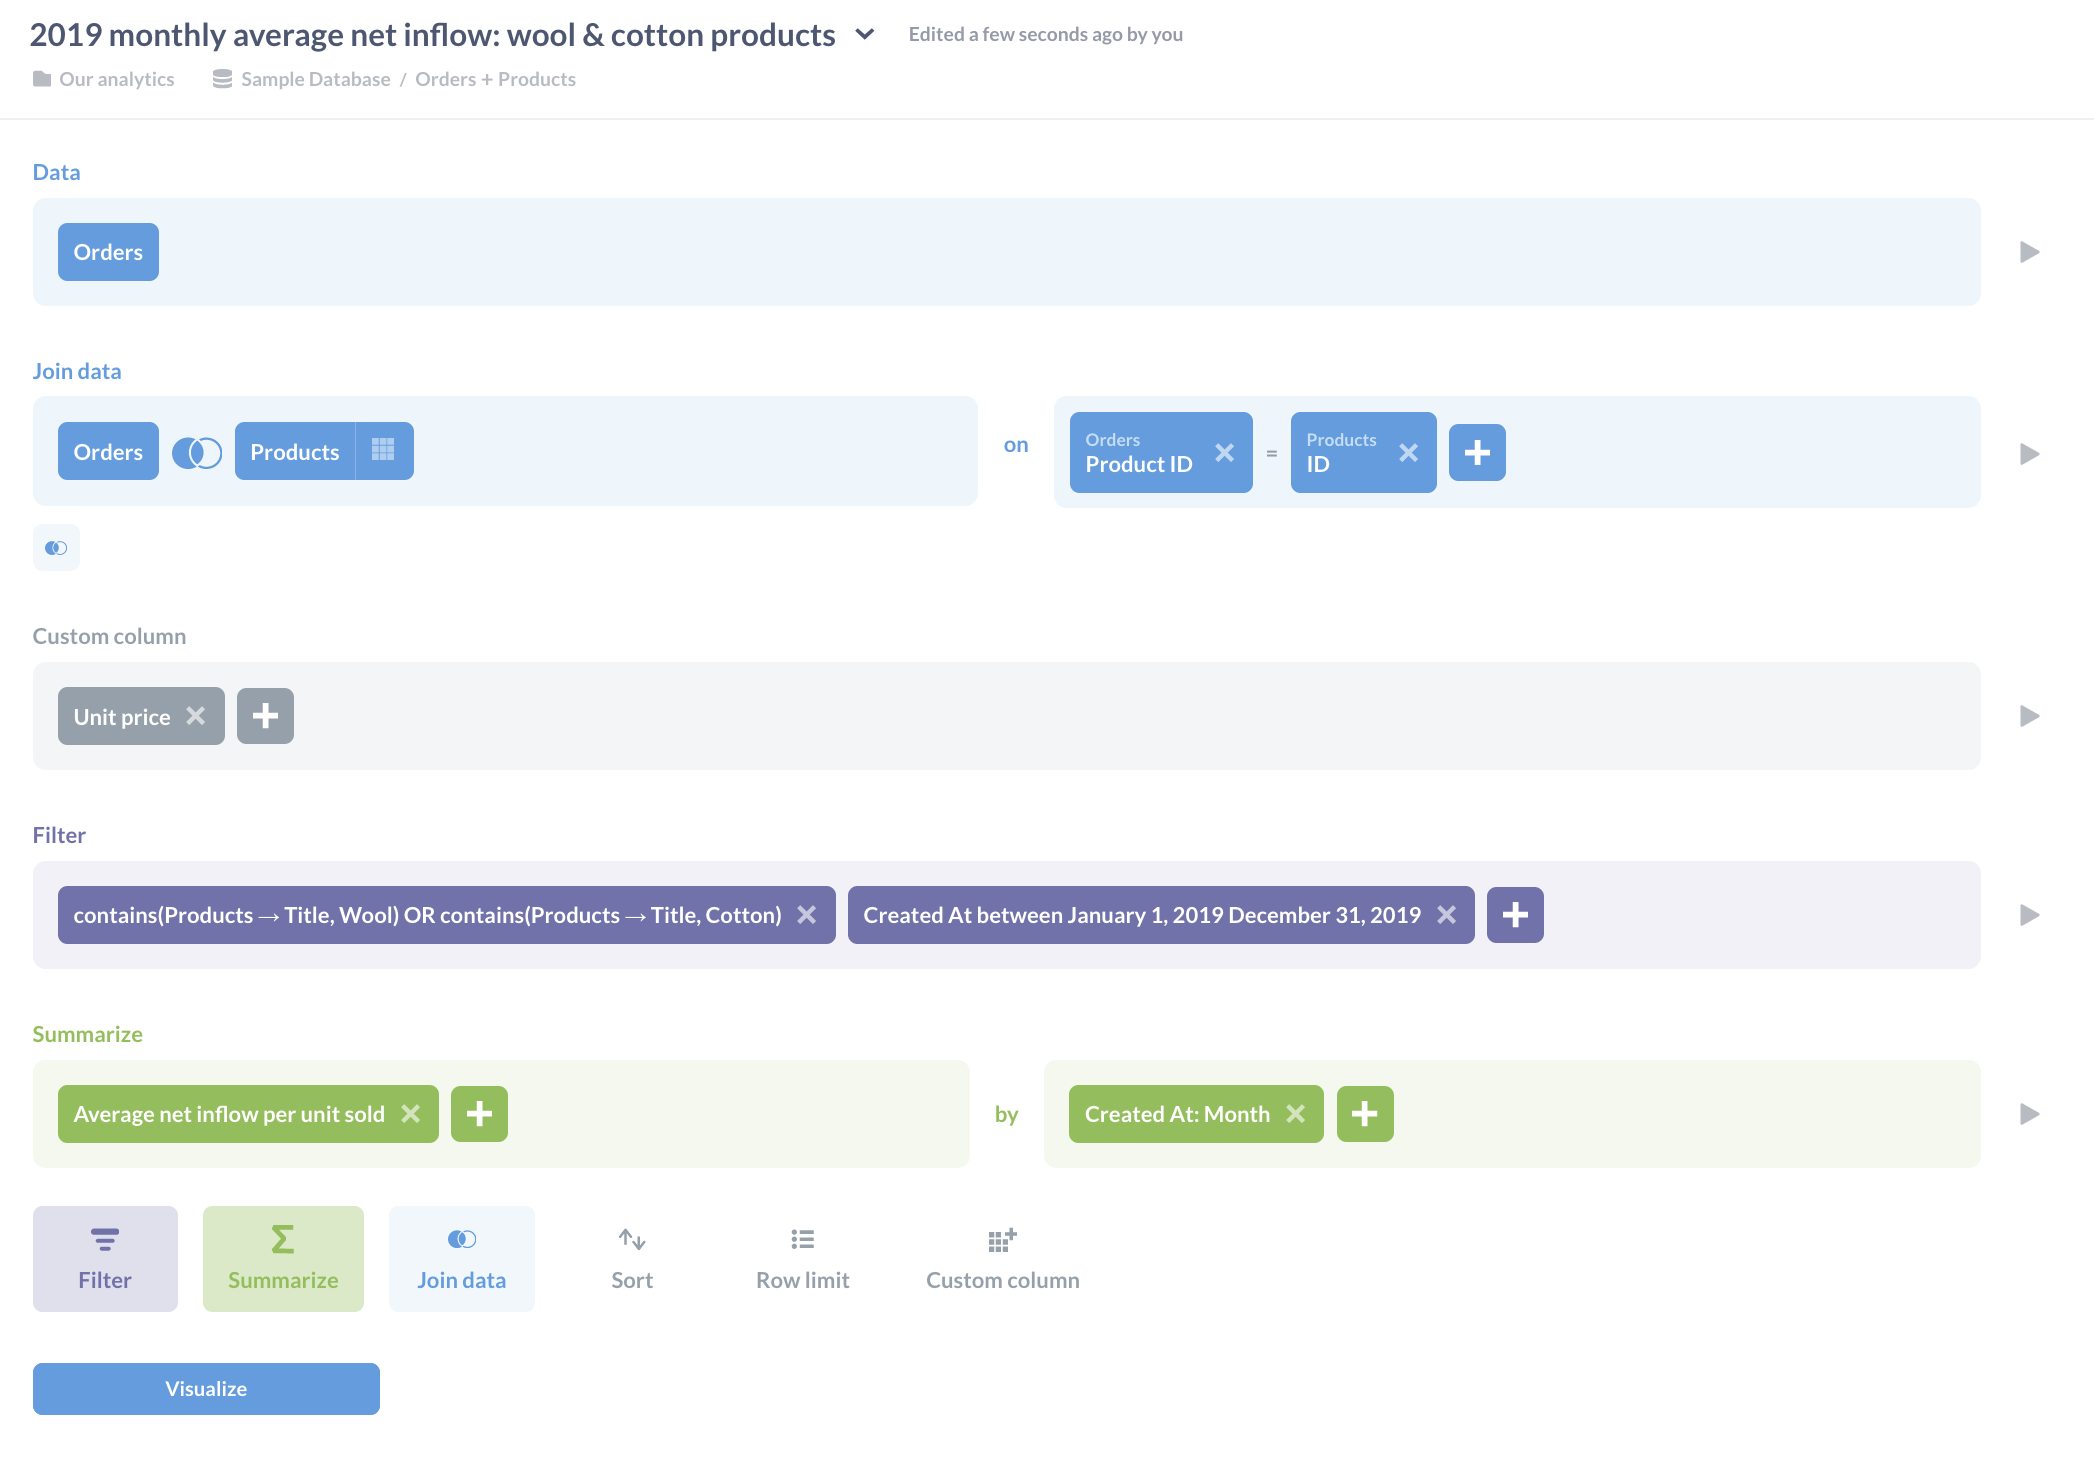
Let’s create a fairly complex (contrived) question using expressions. Say we’ve been tasked to find the average net inflow for wool and cotton products by month in 2019, with net inflow being the selling price minus the cost we paid for the product. In other words: for each wool and cotton product unit sold, how much money on average did we make (or lose) per unit each month in 2019?
To the get these fascinating numbers, we’ll need to use expressions to:
- Compute the selling price per unit (custom column).
- Filter results to only include wool or cotton products (custom filter), and limit those results to 2019.
- Compute the average net inflow (custom summary), and group by month.
Let’s go:
-
We create a custom column named
Unit price. To compute theUnit price, we’ll use an expression to divide the subtotal by the number of units sold (Quantity):= [Subtotal] / [Quantity] -
Next, we’ll use a custom filter expression to filter for orders of
WoolandCottonproducts (i.e. for products that contain “Wool” or “Cotton” somewhere in theirProduct.Title).= contains([Products → Title], "Wool") OR contains([Products → Title], "Cotton") -
We’ll also filter for orders between
01/01/2019and12/31/2019. -
We’ll use a custom expression to create a custom summary. Let’s assume the standard retail markup of 50% (the keystone markup). So if the
Product.Priceis $2, we’ll assume the product cost us $1 to acquire per unit. Given this assumption, we can simply define net inflow per unit sold to be theUnit priceminus half of theProduct.Price. Then we’ll summarize that data by taking the average of those numbers for each order.= Average([Unit price] - [Products → Price] / 2) -
Lastly, we’ll group those orders by
Orders.Created_Atby month.
Here’s our notebook:
We’ll choose to visualize our data as a line chart, which we can click on to drill through our data:
Further reading
- Docs: Custom expressions in the query builder. There are a lot more functions that you can use in expressions that we didn’t cover, so check out the docs for the full list of functions.
- Time series comparisons shows how to use custom expressions to visualize and compare time series.
- Cleaning and formatting text uses custom expressions to deal with messy and missing data.