

Article
Getting started with Metabase
Get to know your way around Metabase and create your first question using the sample database.
Metabase is a simple and powerful analytics tool which lets anyone learn and make decisions from their company’s data—no technical knowledge required.
Installation and setup
If your Metabase isn’t up and running yet, check out:
The Metabase home page
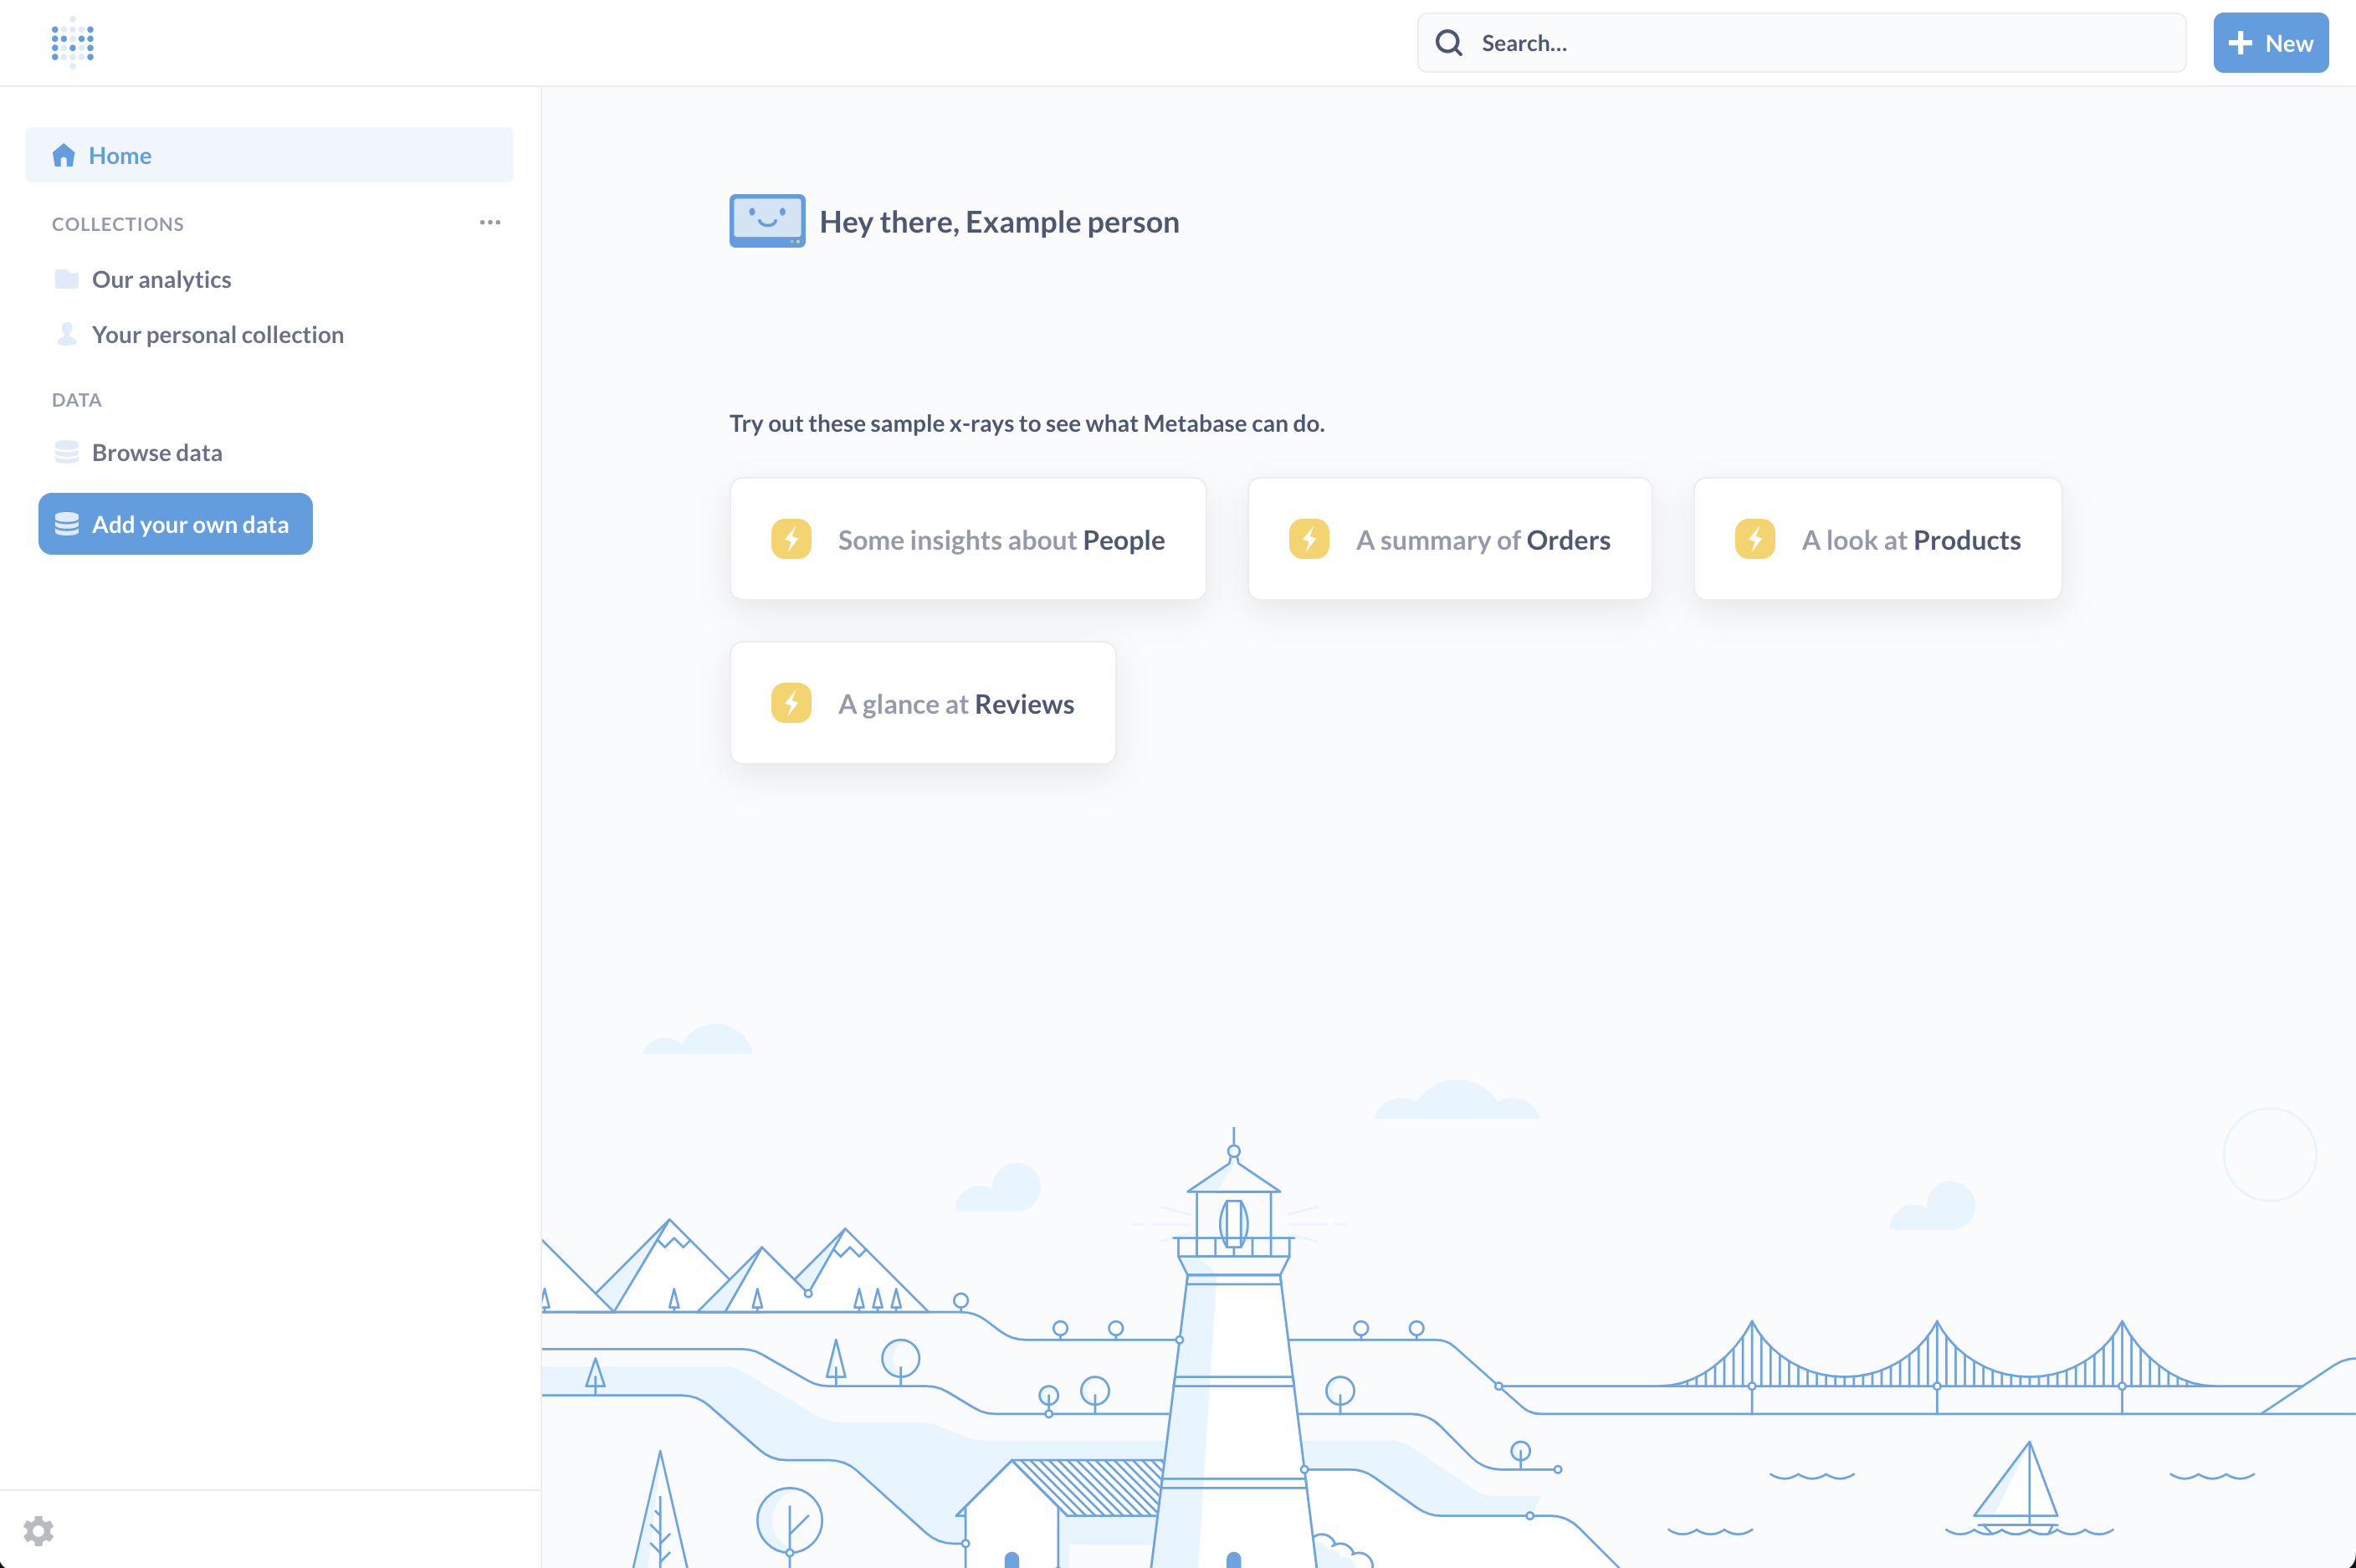
Fresh out of the box, Metabase will show you a few things on the home page:
- Some automatic explorations of your tables that you can look at and save as dashboard.
- A navigation sidebar that lists:
- Home button to return to your Metabase home page.
- Collections, where you’ll store all of your questions, dashboards, and models. You have your own personal collection to store drafts and experiments that aren’t yet ready to share.
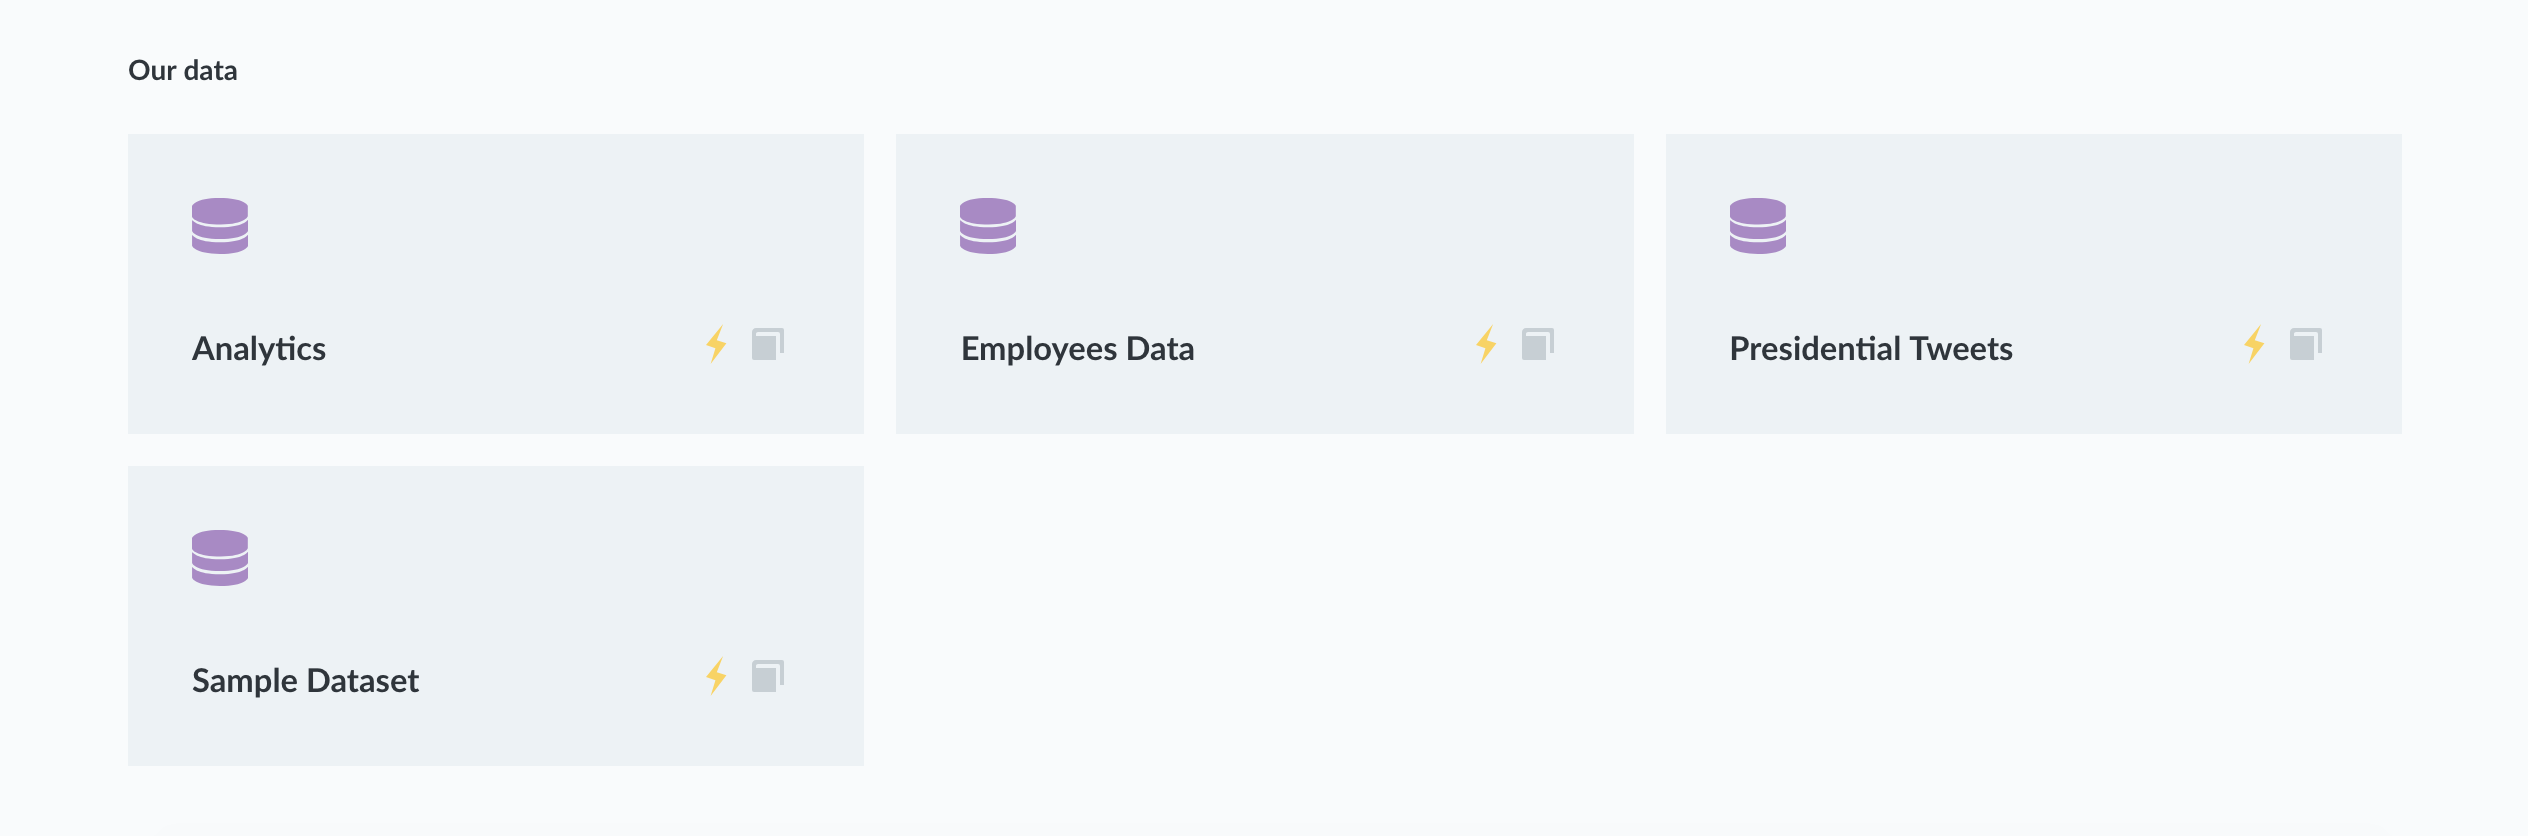
- Data section, which lists all of the data sources your Metabase is connected to.
- Settings (the gear icon in the upper right).
You can also Bookmark your favorite items, and they’ll appear toward the top of the navigation sidebar.
To open and close the navigation sidebar, click on the Metabase logo in the upper left.
Asking a new question
A question in Metabase is a query, the results of that query, and the visualization and formatting of those results (even if that visualization is just a table). Questions have titles, IDs, and unique URLs you can copy and share with others.
You can play around with a question by filtering and summarizing its results, save those explorations as new questions, and add questions to dashboards. But we’re getting ahead of ourselves; for the next few examples, we’ll be using the Sample Database that comes with Metabase.
Click on + New in the main nav, and select Question. You can start a new question from:
- A model
- A raw table
- A saved question
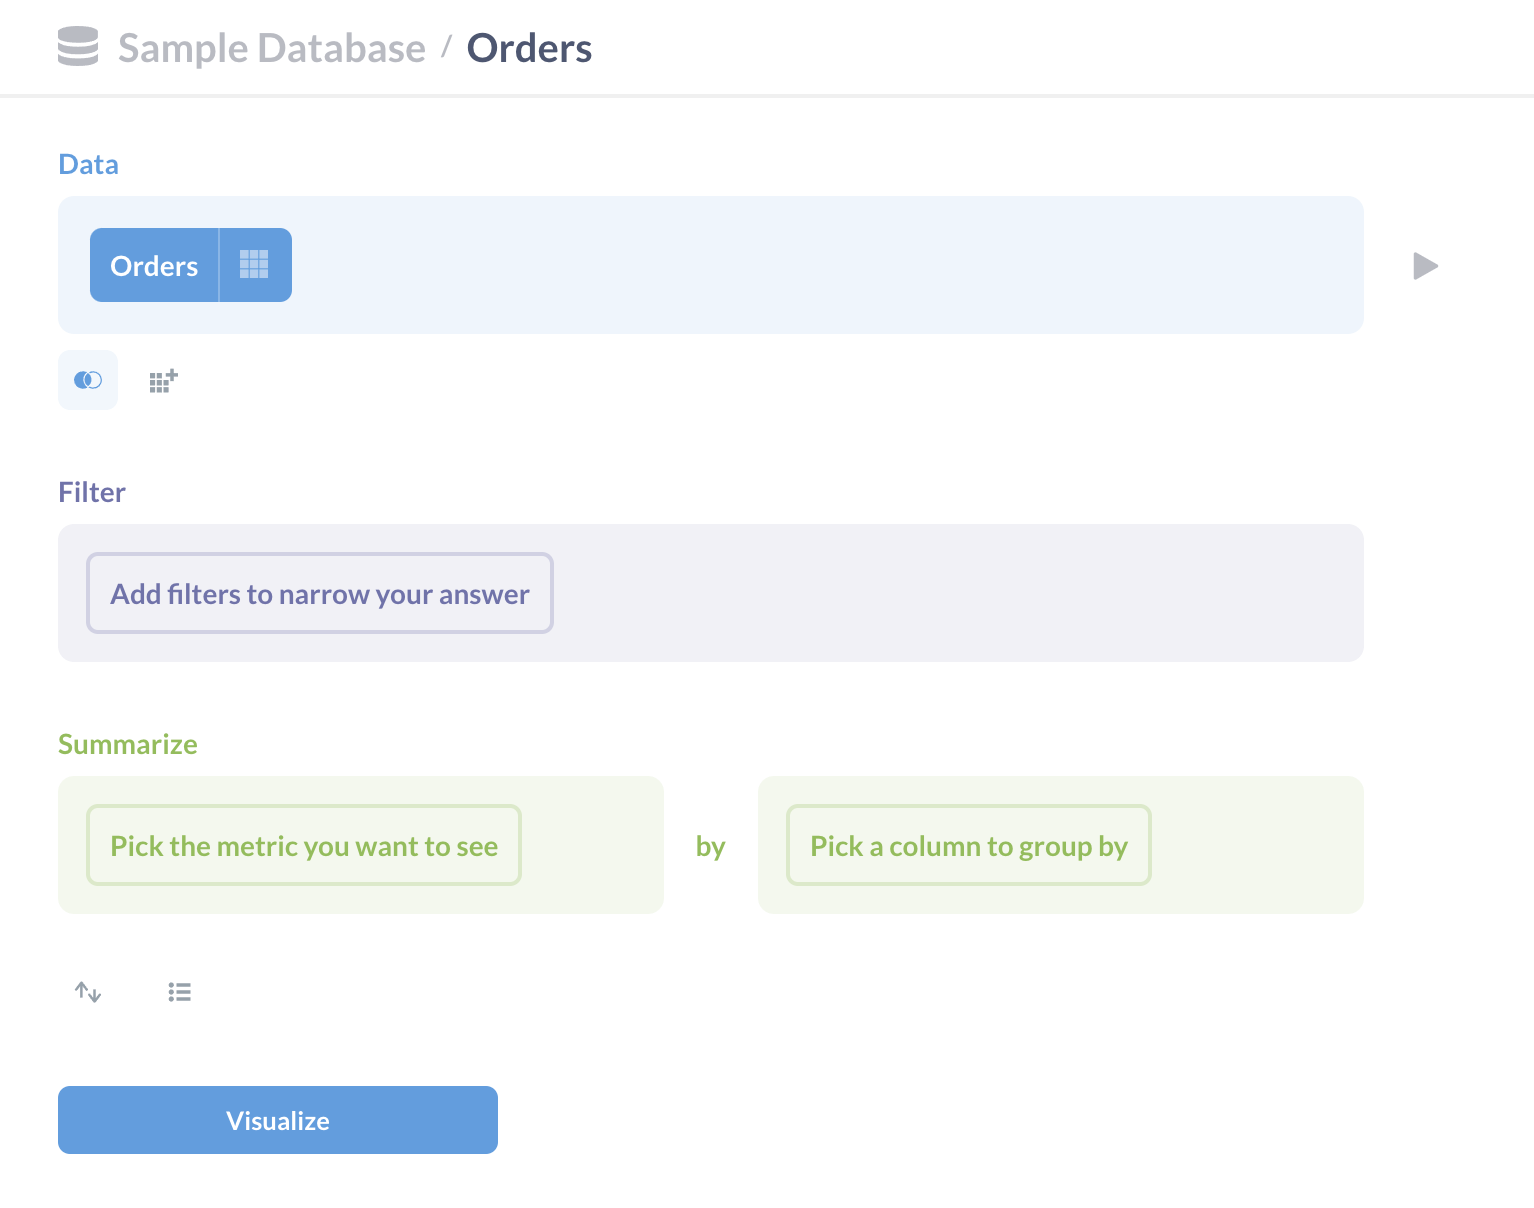
For now, let’s start from Raw data > Sample database > Orders. Metabase will open up the query builder.
Filtering data
The Orders table has a bunch of fake data in it about product orders from a made-up company. Let’s say we want to know:
How many orders have been placed with a subtotal (before tax) greater than $40?
More precisely, this question translates to: “How many records (or rows) are in the Orders table that have a value greater than 40 in the Subtotal column?”
To find out, we want to filter the data by the field we’re interested in, which in this case is the Subtotal. Then we want to count the filtered rows.
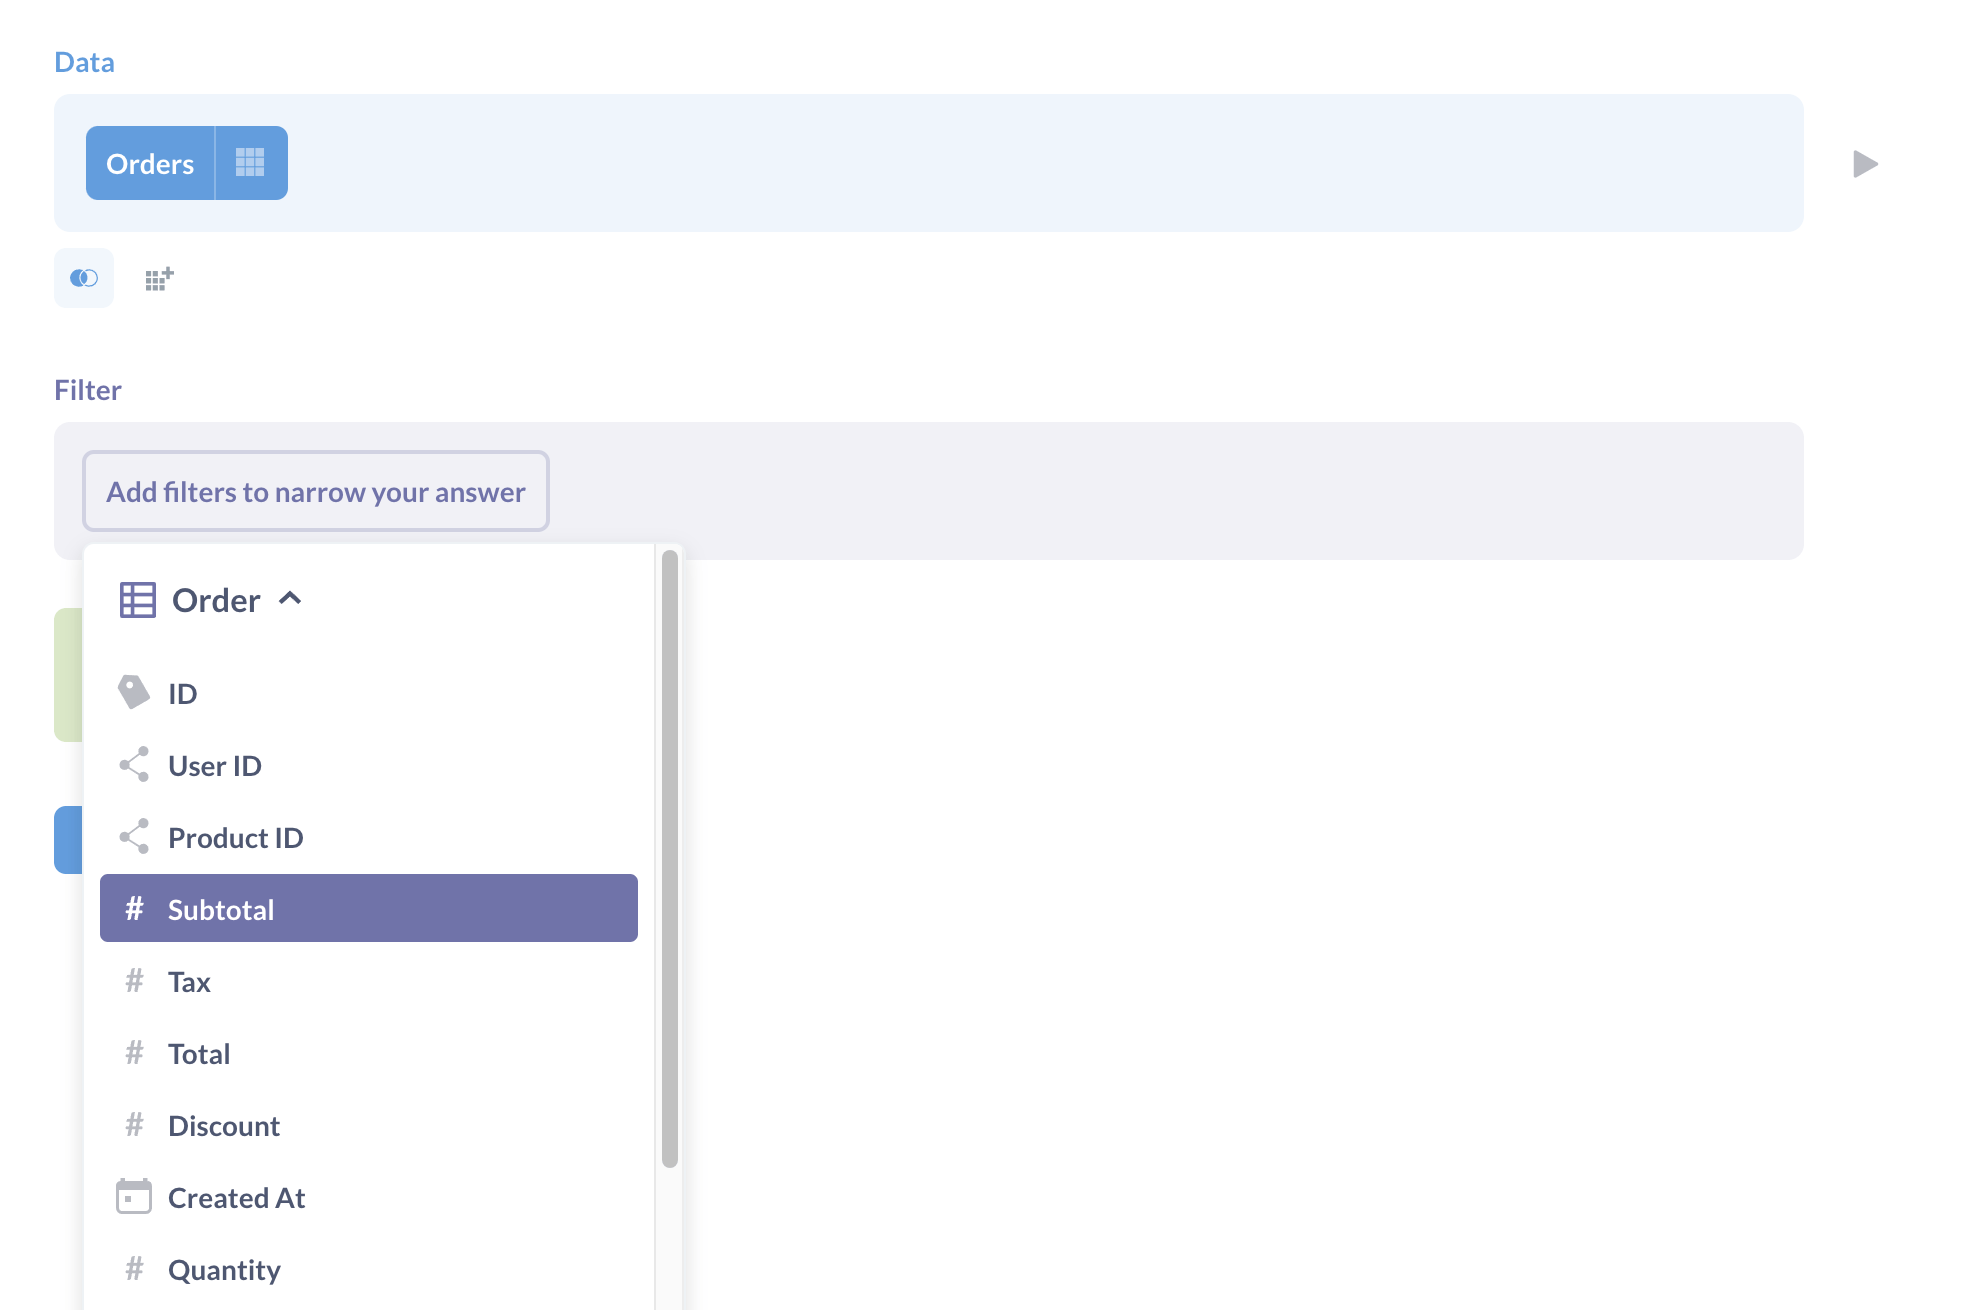
In the Filter step, we’ll click the purple Add filters to narrow your answer button, and we’ll select Subtotal as the column to filter on. In the dropdown menu, change “Equal to” to “Greater than”, enter 40 in the input field, then click Add filter.
Previewing results
With each step, you can click on the triangle on the right to preview the results so far.
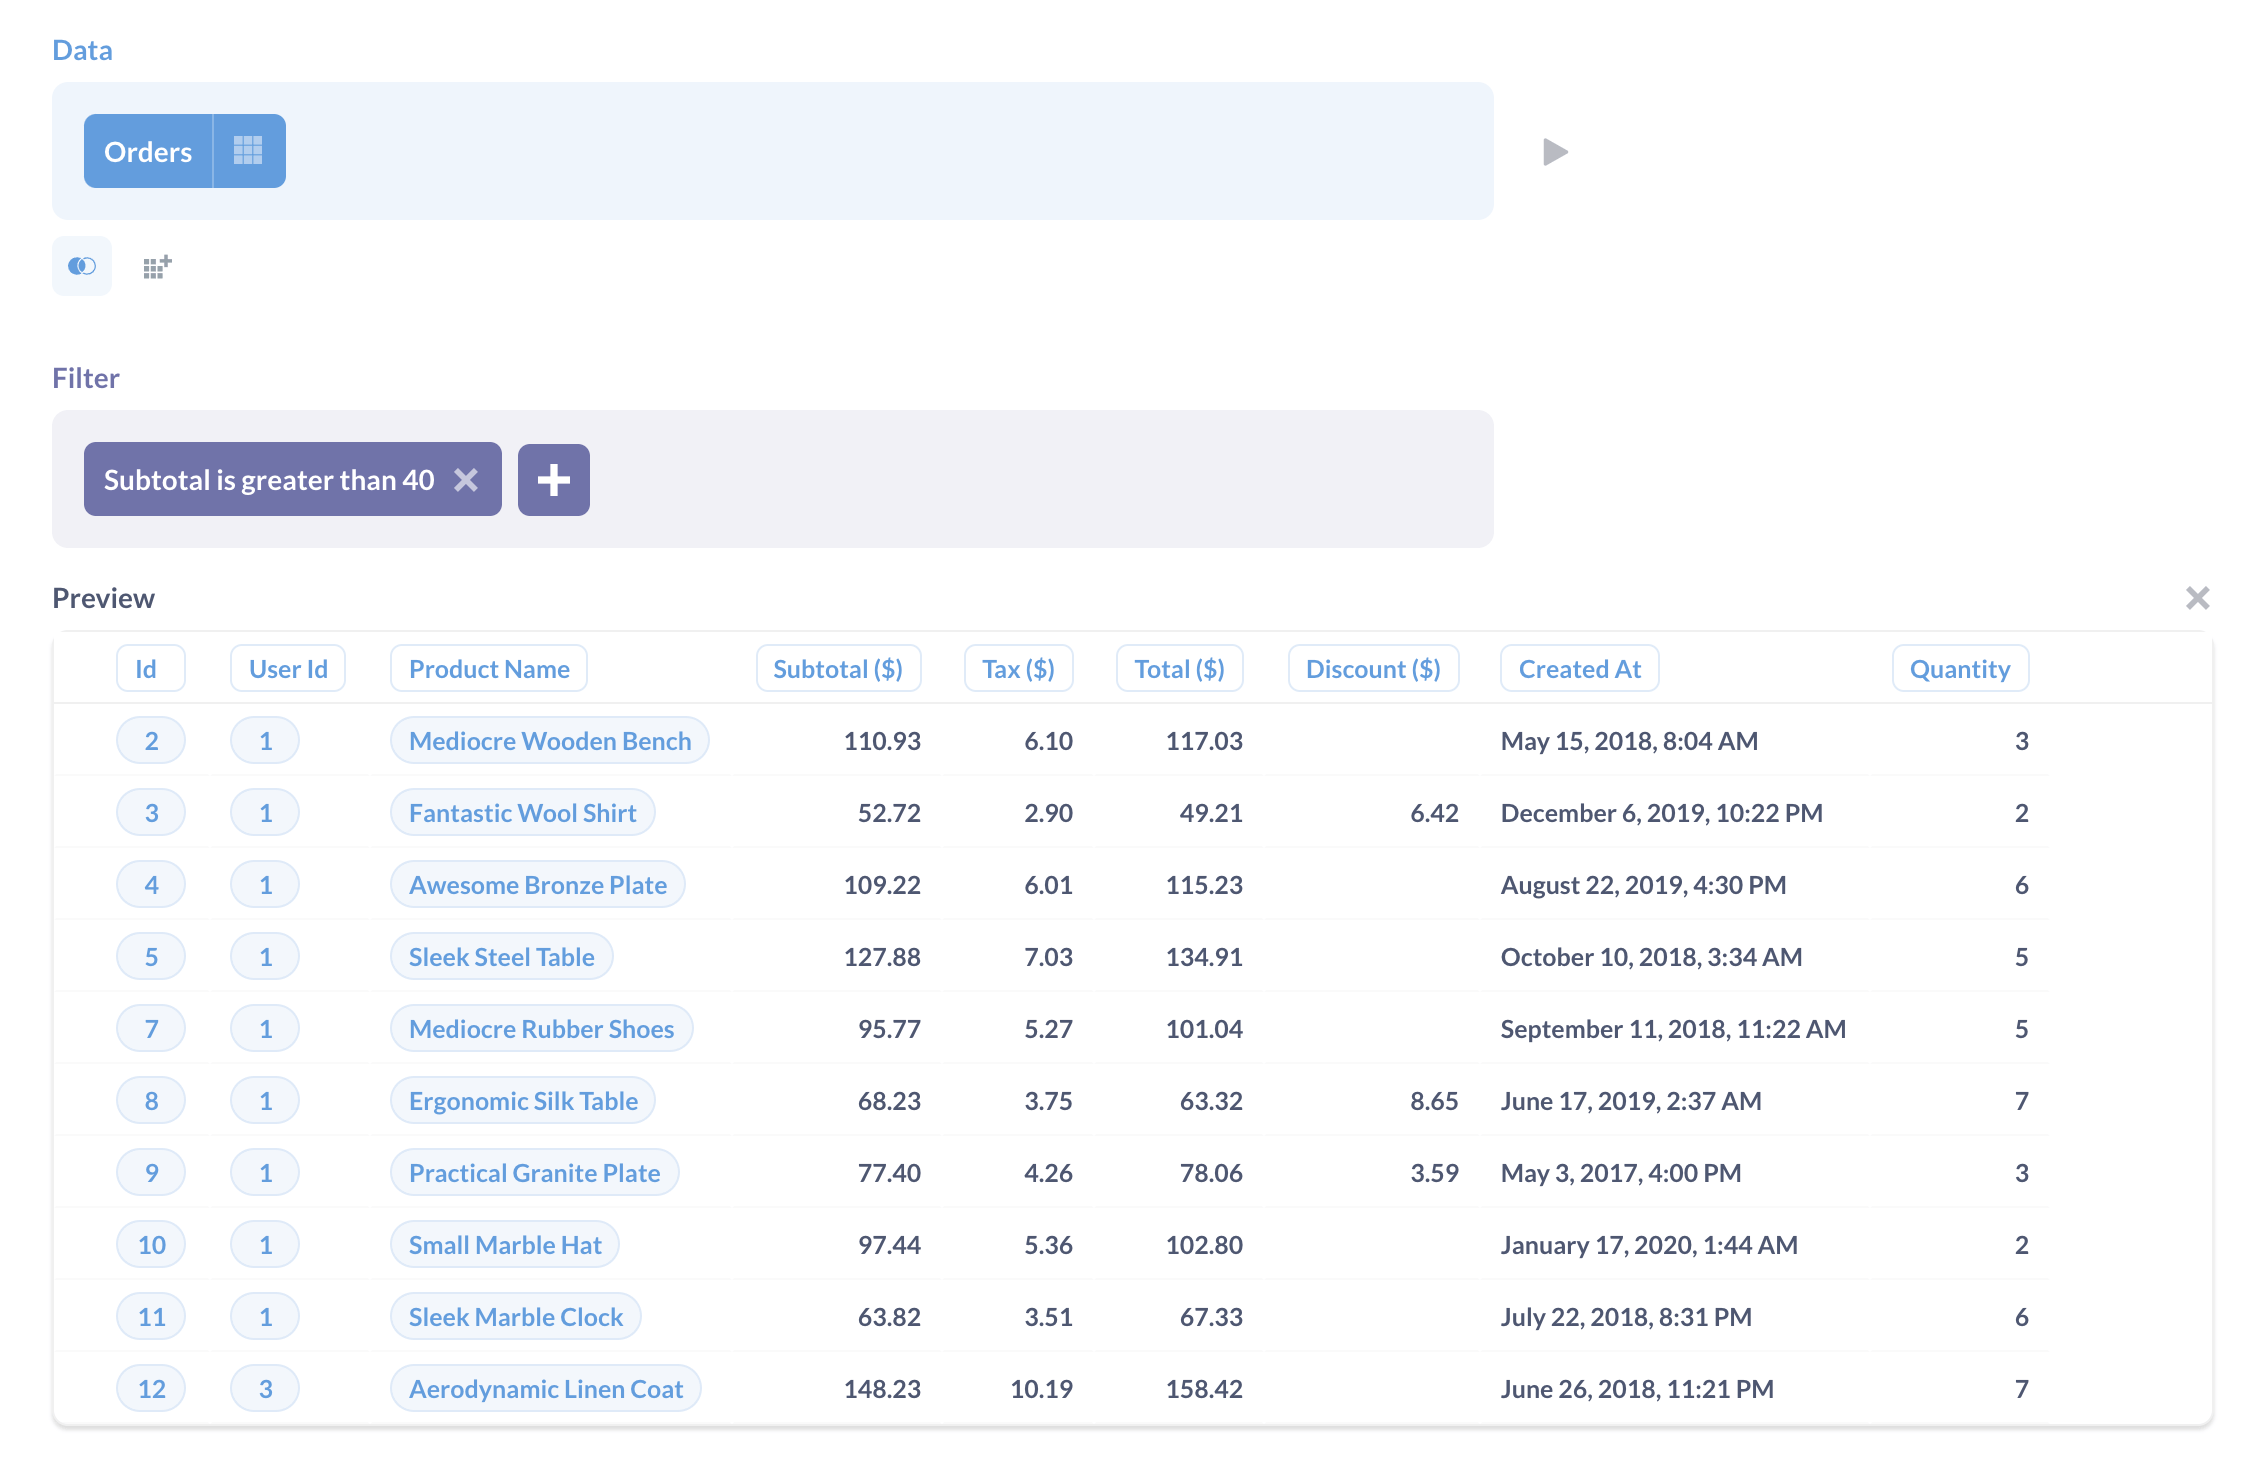
As expected, all of the subtotals are over $40 after the filter has been applied.
To close the preview, you can click on the X in the upper right of the preview.
Summarizing data
When we ask things like “how many,” “what’s the total,” “what’s the average,” etc., we’re talking about summarizing our data. That is, we’re talking about metrics. The metric in this case the number (or count) of orders after we’ve filtered for orders greater than $40. We’ll click the Pick the metric you want to see button in the Summarize step and select Count of rows.
When we click Visualize, Metabase will show us that there were 16,309 orders with a subtotal greater than $40. Said another way, there were 16,309 records in the Orders table that made it through our filter.
Grouping our results
That count is useful, but it would be even more useful if we knew when our customers placed these big orders—more specifically, if we knew how many greater-than-40 orders people placed each month.
We can return to the editor by hitting the back button, or by clicking on the Editor button in the upper right (the icon looks like a bulleted list). Alternatively, we can also click on the Filter and Summarize buttons to revise our question while staying on this page.
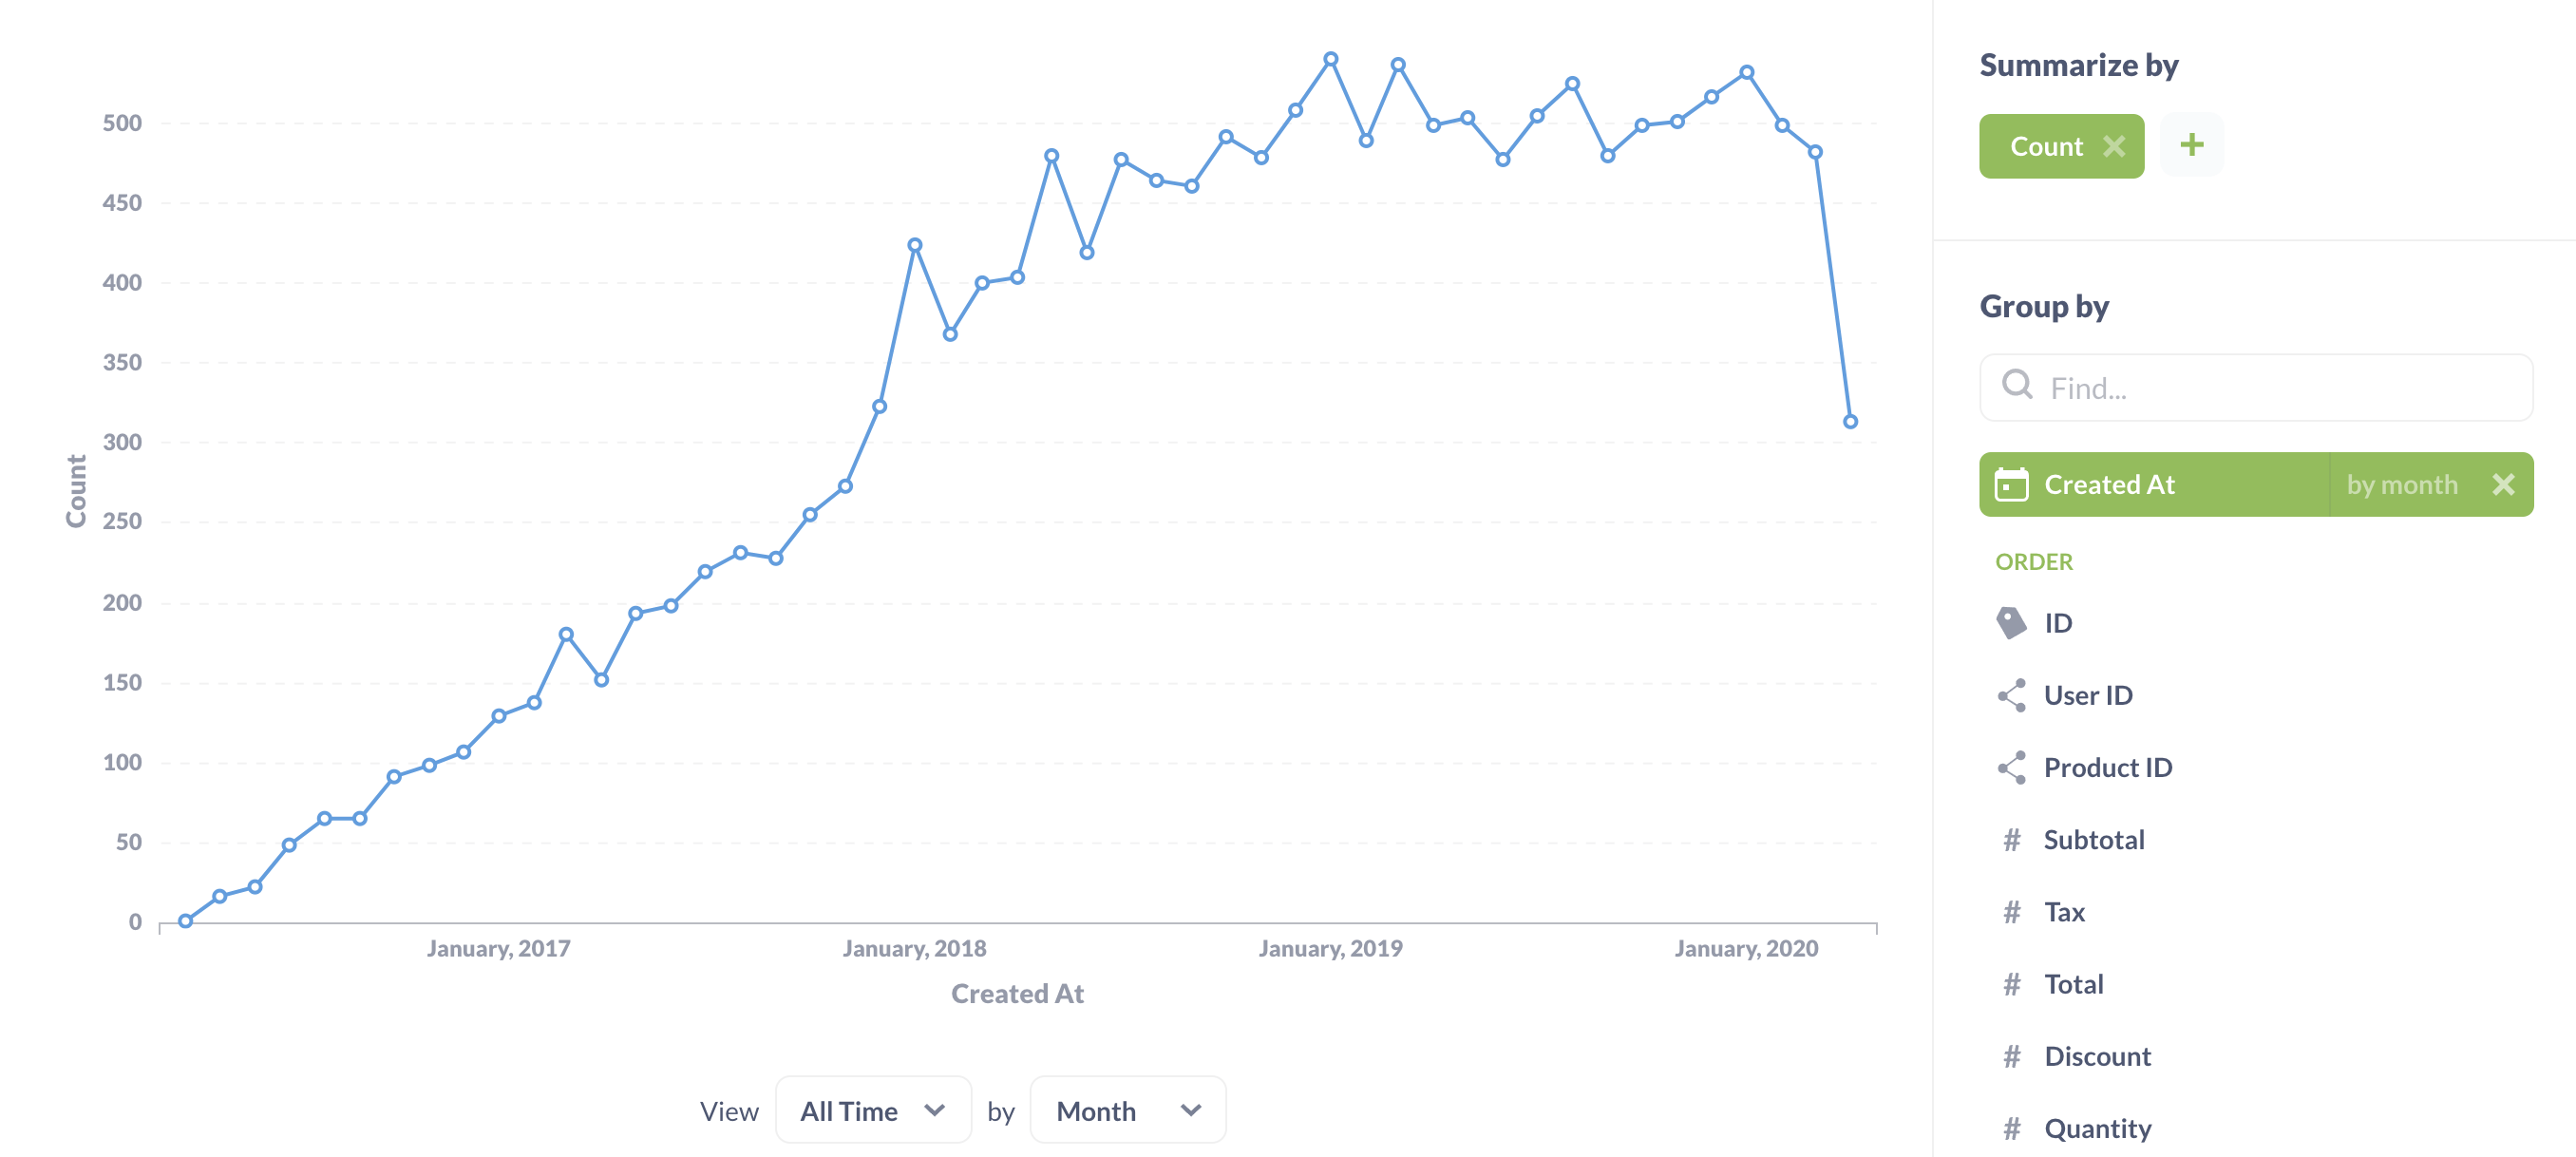
Since we want to group our results by month, we’ll click Summarize. If we open the Summarize sidebar, below where we picked our metric, there’s a list of all the columns that we can use to group our data together. The column we want to group by is Created At, because grouping by the orders’ creation date will give us separate counts of orders over $40 for each month, based on when each order was placed (or Created_at). We’ll select Created At, and Metabase immediately shows us a line chart of the orders over time. The default grouping for Created_At is by month, but if we wanted to group by date, week, year, or something else, we could do that by clicking by month next to Created At and selecting a different option from the dropdown.
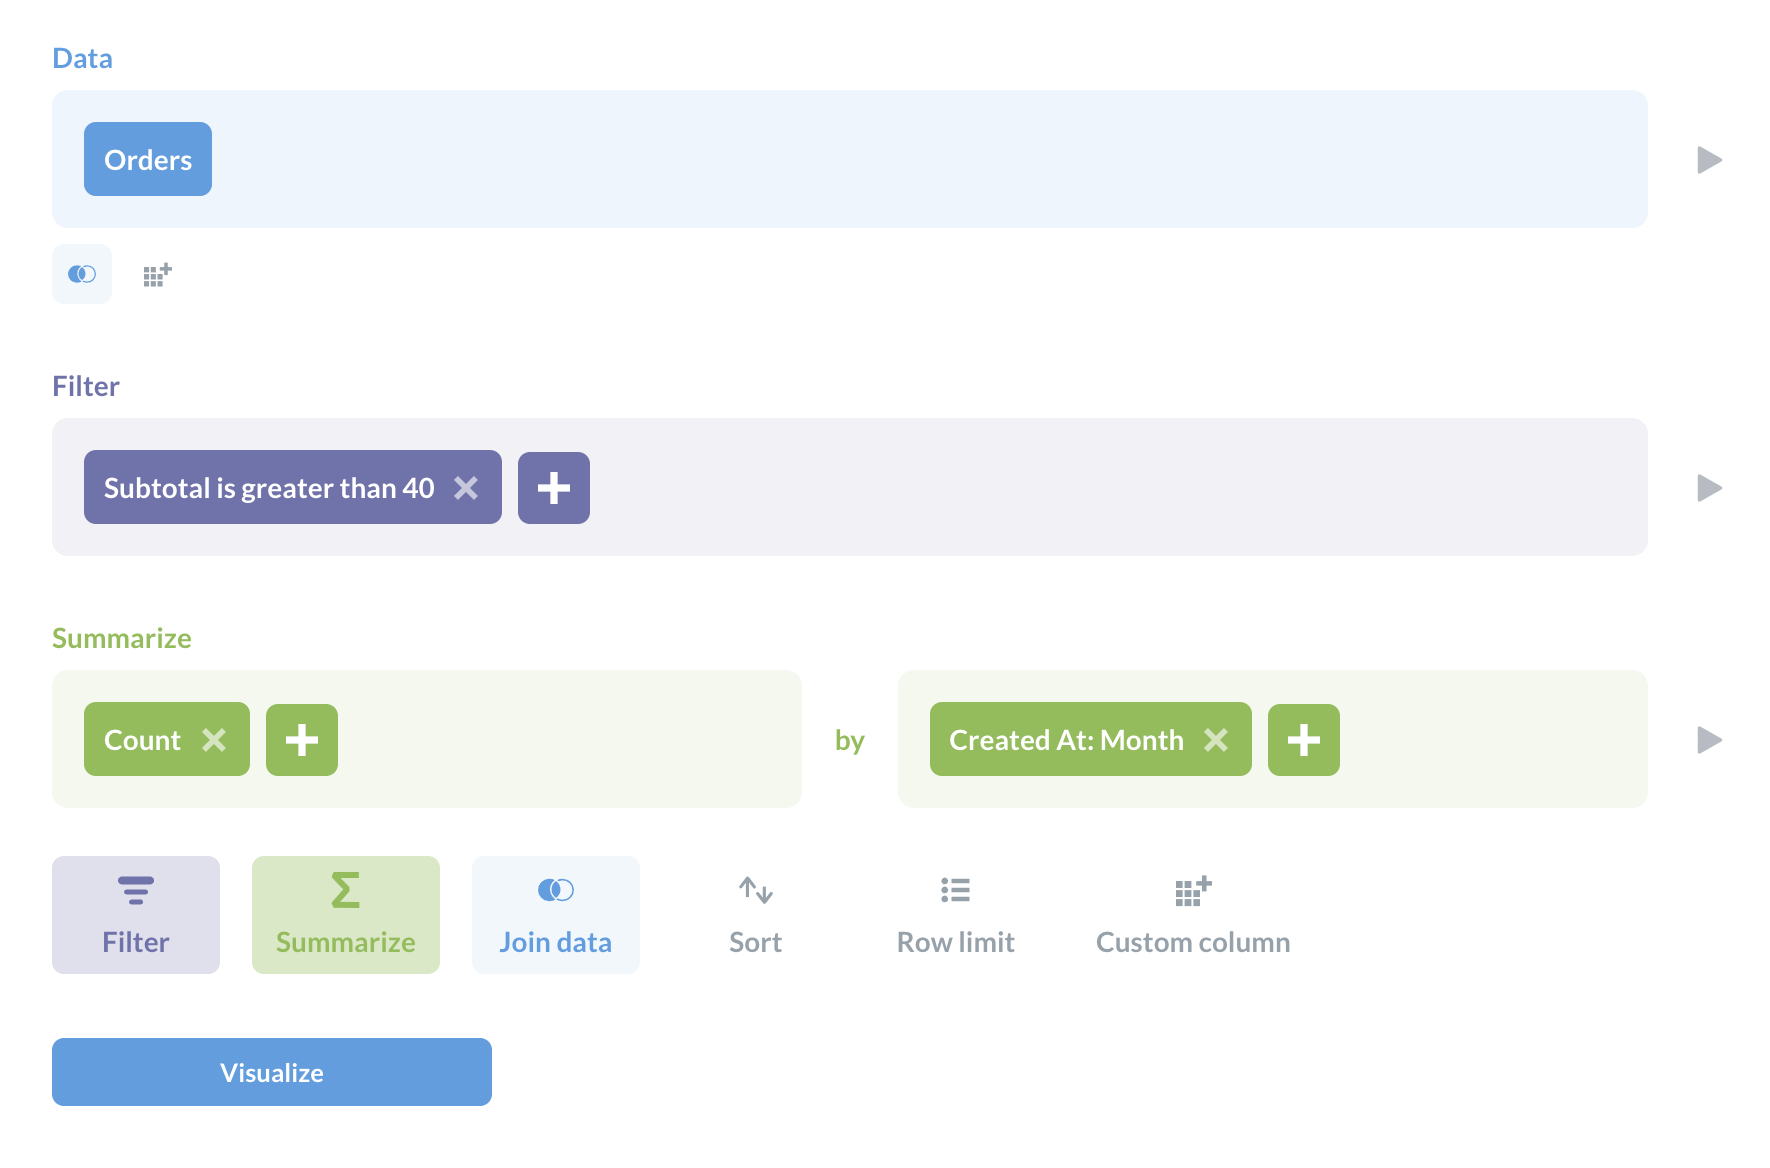
We can keep tweaking our question using the sidebar, or return to our notebook by clicking on the Editor button. Here’s our updated question with the new summarize step:
Changing the visualization
Metabase can present the answers to questions in a variety of ways. To change the visualization, just select one of the options from the Visualization sidebar.
If we want to check the results as a table, we can click the little toggle at the bottom center of the page to toggle from our chart to the table of data and back again.
For other visualization options, click the blue Visualization button in the bottom left. For example, let’s visualize our question as an area chart.
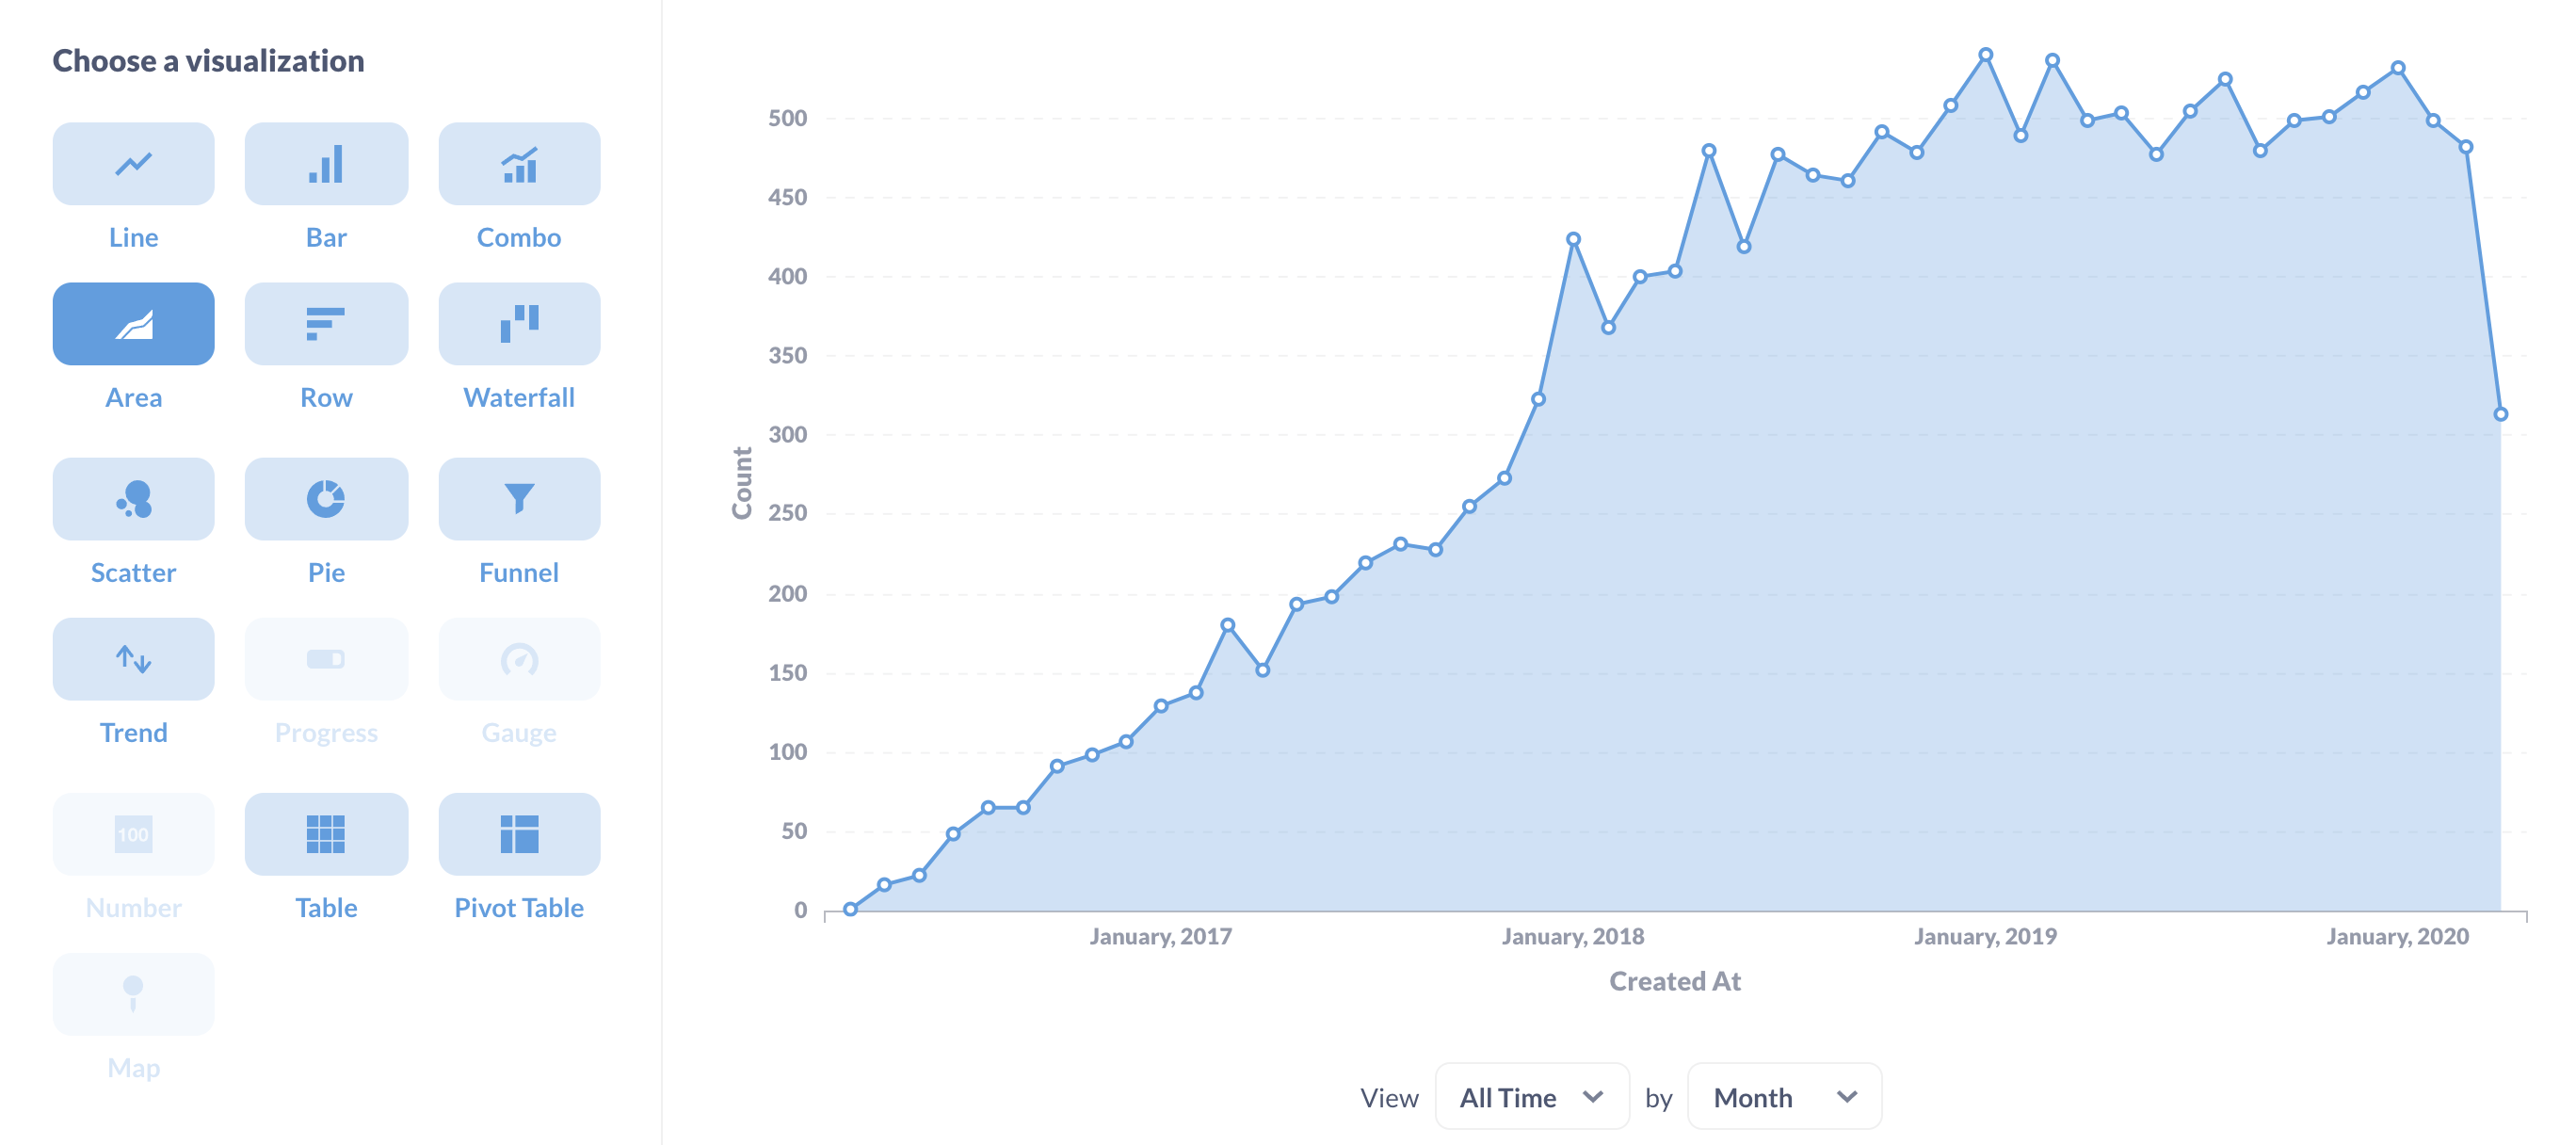
Some visualizations aren’t the best way to show an answer to a question, so Metabase will fade out the option. For example, it wouldn’t make sense to show the total number of orders over $40 as a map.
If you want, you can try playing around with your question, like changing the number 40 to a different number. To do that, just click on the filter badge below the page title.
To learn more about charts, check out Visualizing data.
Next up
Keep reading to learn how to add questions to dashboards and share your work with others.
If you’d like more technical resources to set up your data stack with Metabase, connect with a Metabase Expert.