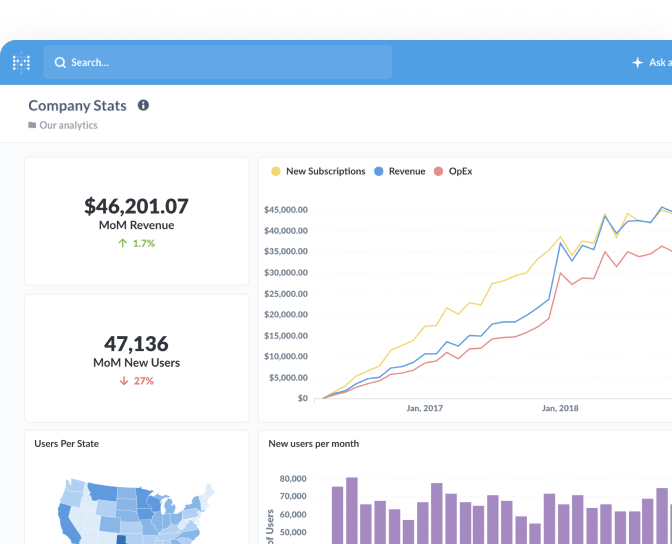
Dashboard
What is a dashboard?
A dashboard is a data visualization tool that holds important charts and text, collected and arranged on a single screen. Dashboards provide a high-level, centralized look at KPIs and other business metrics, and can cover everything from overall business health to the success of a specific project or campaign.
The term comes from the automotive dashboard, which — like its business intelligence counterpart — provides status updates and warnings about important functions (just for things like low brake fluid instead of how your recent marketing campaign performed).
Dashboard vs. report
Dashboards aren’t exactly the same as reports, though you’ll sometimes hear people refer to dashboards as reports. The difference is that dashboards tend to be easier to read and understand at a glance, while traditional reports provide a more detailed look at a subject.
Unlike traditional reports, dashboards are viewable on a single screen and often incorporate some interactive elements. You’re probably not going to print out a dashboard to read, which would make a lot more sense for a traditional report that draws on static, historical data. However, just like with traditional reports, you can send out updated dashboards according to a set schedule, like with dashboard subscriptions in Metabase.
Dashboards in Metabase
In Metabase, dashboards are made up of cards that contain either questions or text. You have a lot of options when creating and editing dashboards in Metabase, like:
- Arranging and resizing cards to fit your desired dashboard design.
- Making your dashboards interactive by setting custom click behavior and linking one dashboard to another.
- Adding filter widgets and wiring them up to specific fields on individual cards.
- Using Markdown to annotate your dashboard with text or GIFs.
- Sharing your dashboard with a link or by embedding it in your website or app.
Example dashboard
Figure 1 shows an example of a dashboard in Metabase with three question cards and three filter widgets. If someone inputs a customer ID, customer name, or date into one of the filter widgets, the charts will adjust accordingly to fit reflect that added filter.


