Markdown in dashboards
How to use Markdown in your dashboards for fun and profit.
Building effective dashboards often involves providing context for folks to give them insight into how or why a calculation exists. While precise titles, descriptions, and labeled axes can go a long way toward clarifying your visualizations, Metabase also allows you to add flexible text boxes to your dashboards. This post will show you how to take full advantage of this feature using Markdown syntax.
Adding text to dashboards
Select a dashboard you’d like to add text to, and click on the pencil icon to edit the dashboard. Click on the text box button in the dashboard toolbar (shown as Aa). A text box will appear, which you can move around just as you would a question box. To resize the text box, click and drag on its bottom right corner.
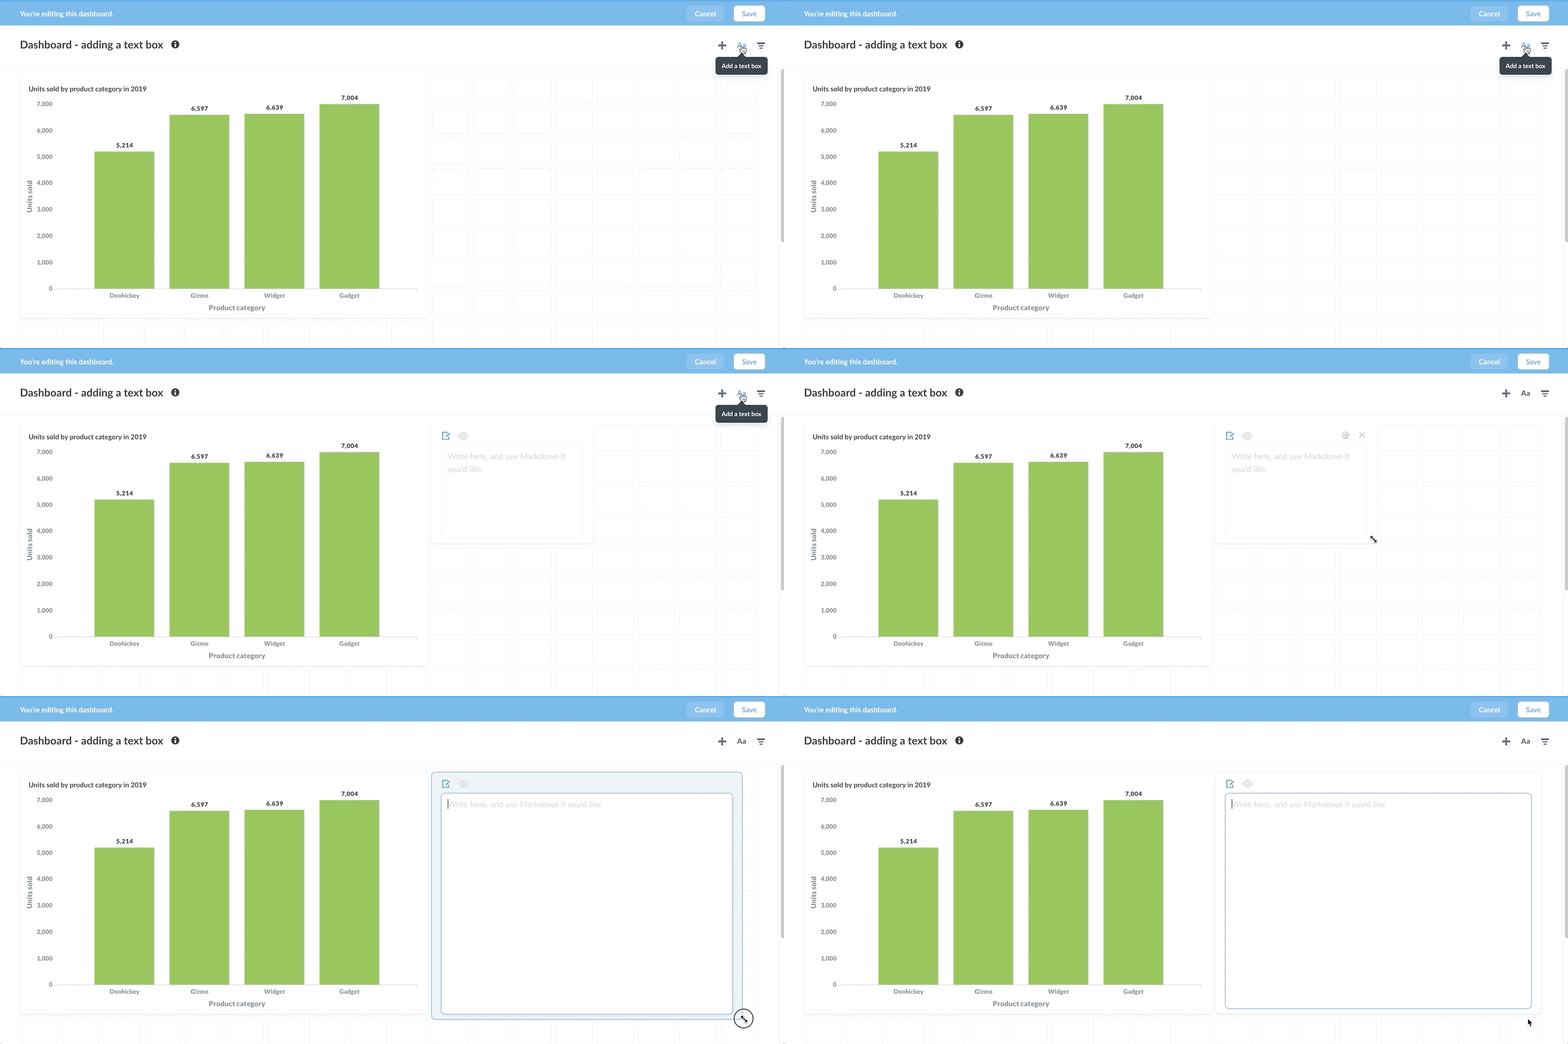
Writing in the text box
To interact with a text box, you’ll need to be in edit mode in a dashboard. Click on the pencil icon in the dashboard toolbar in the upper right of the dashboard.
Text boxes in Metabase have two modes.
- Edit text (pencil icon).
- Rendered view (eye icon).
The text editor in Metabase employs a lightweight markup language called Markdown. If you’ve never used Markdown before, it takes some getting used to, but you’ll soon learn to appreciate its simplicity. Markdown can make writers feel like coders and coders feel at home.
How Markdown works
To create different heading levels like this:

You’d write:
# Heading 1

## Heading 2

### Heading 3

#### Heading 4

##### Heading 5

###### Heading 6
The plain text ## Heading 2 is rendered as the HTML code:
<h2>
  Heading
  <h2></h2>
</h2>
You can use Markdown syntax to add links, images, gifs, lists, codeblocks, blockquotes, and more. Here’s a text box with heading, paragraph, blockquote, and code block:

You can do everything this post does and more using text boxes in Metabase. The big deal with Markdown is that you don’t have to write tedious HTML, and Markdown is human-readable even before Metabase renders it. Markdown’s minimalist feature set will keep you focused on the content, and provide a standardized look across your dashboards.
You can learn more about Markdown syntax in this guide, as well as from one of Markdown’s original creators, which also includes the philosophy behind Markdown. As a bonus, the site allows you to view its content in Markdown syntax.
Example text box
Here is an example dashboard with a question and text box:
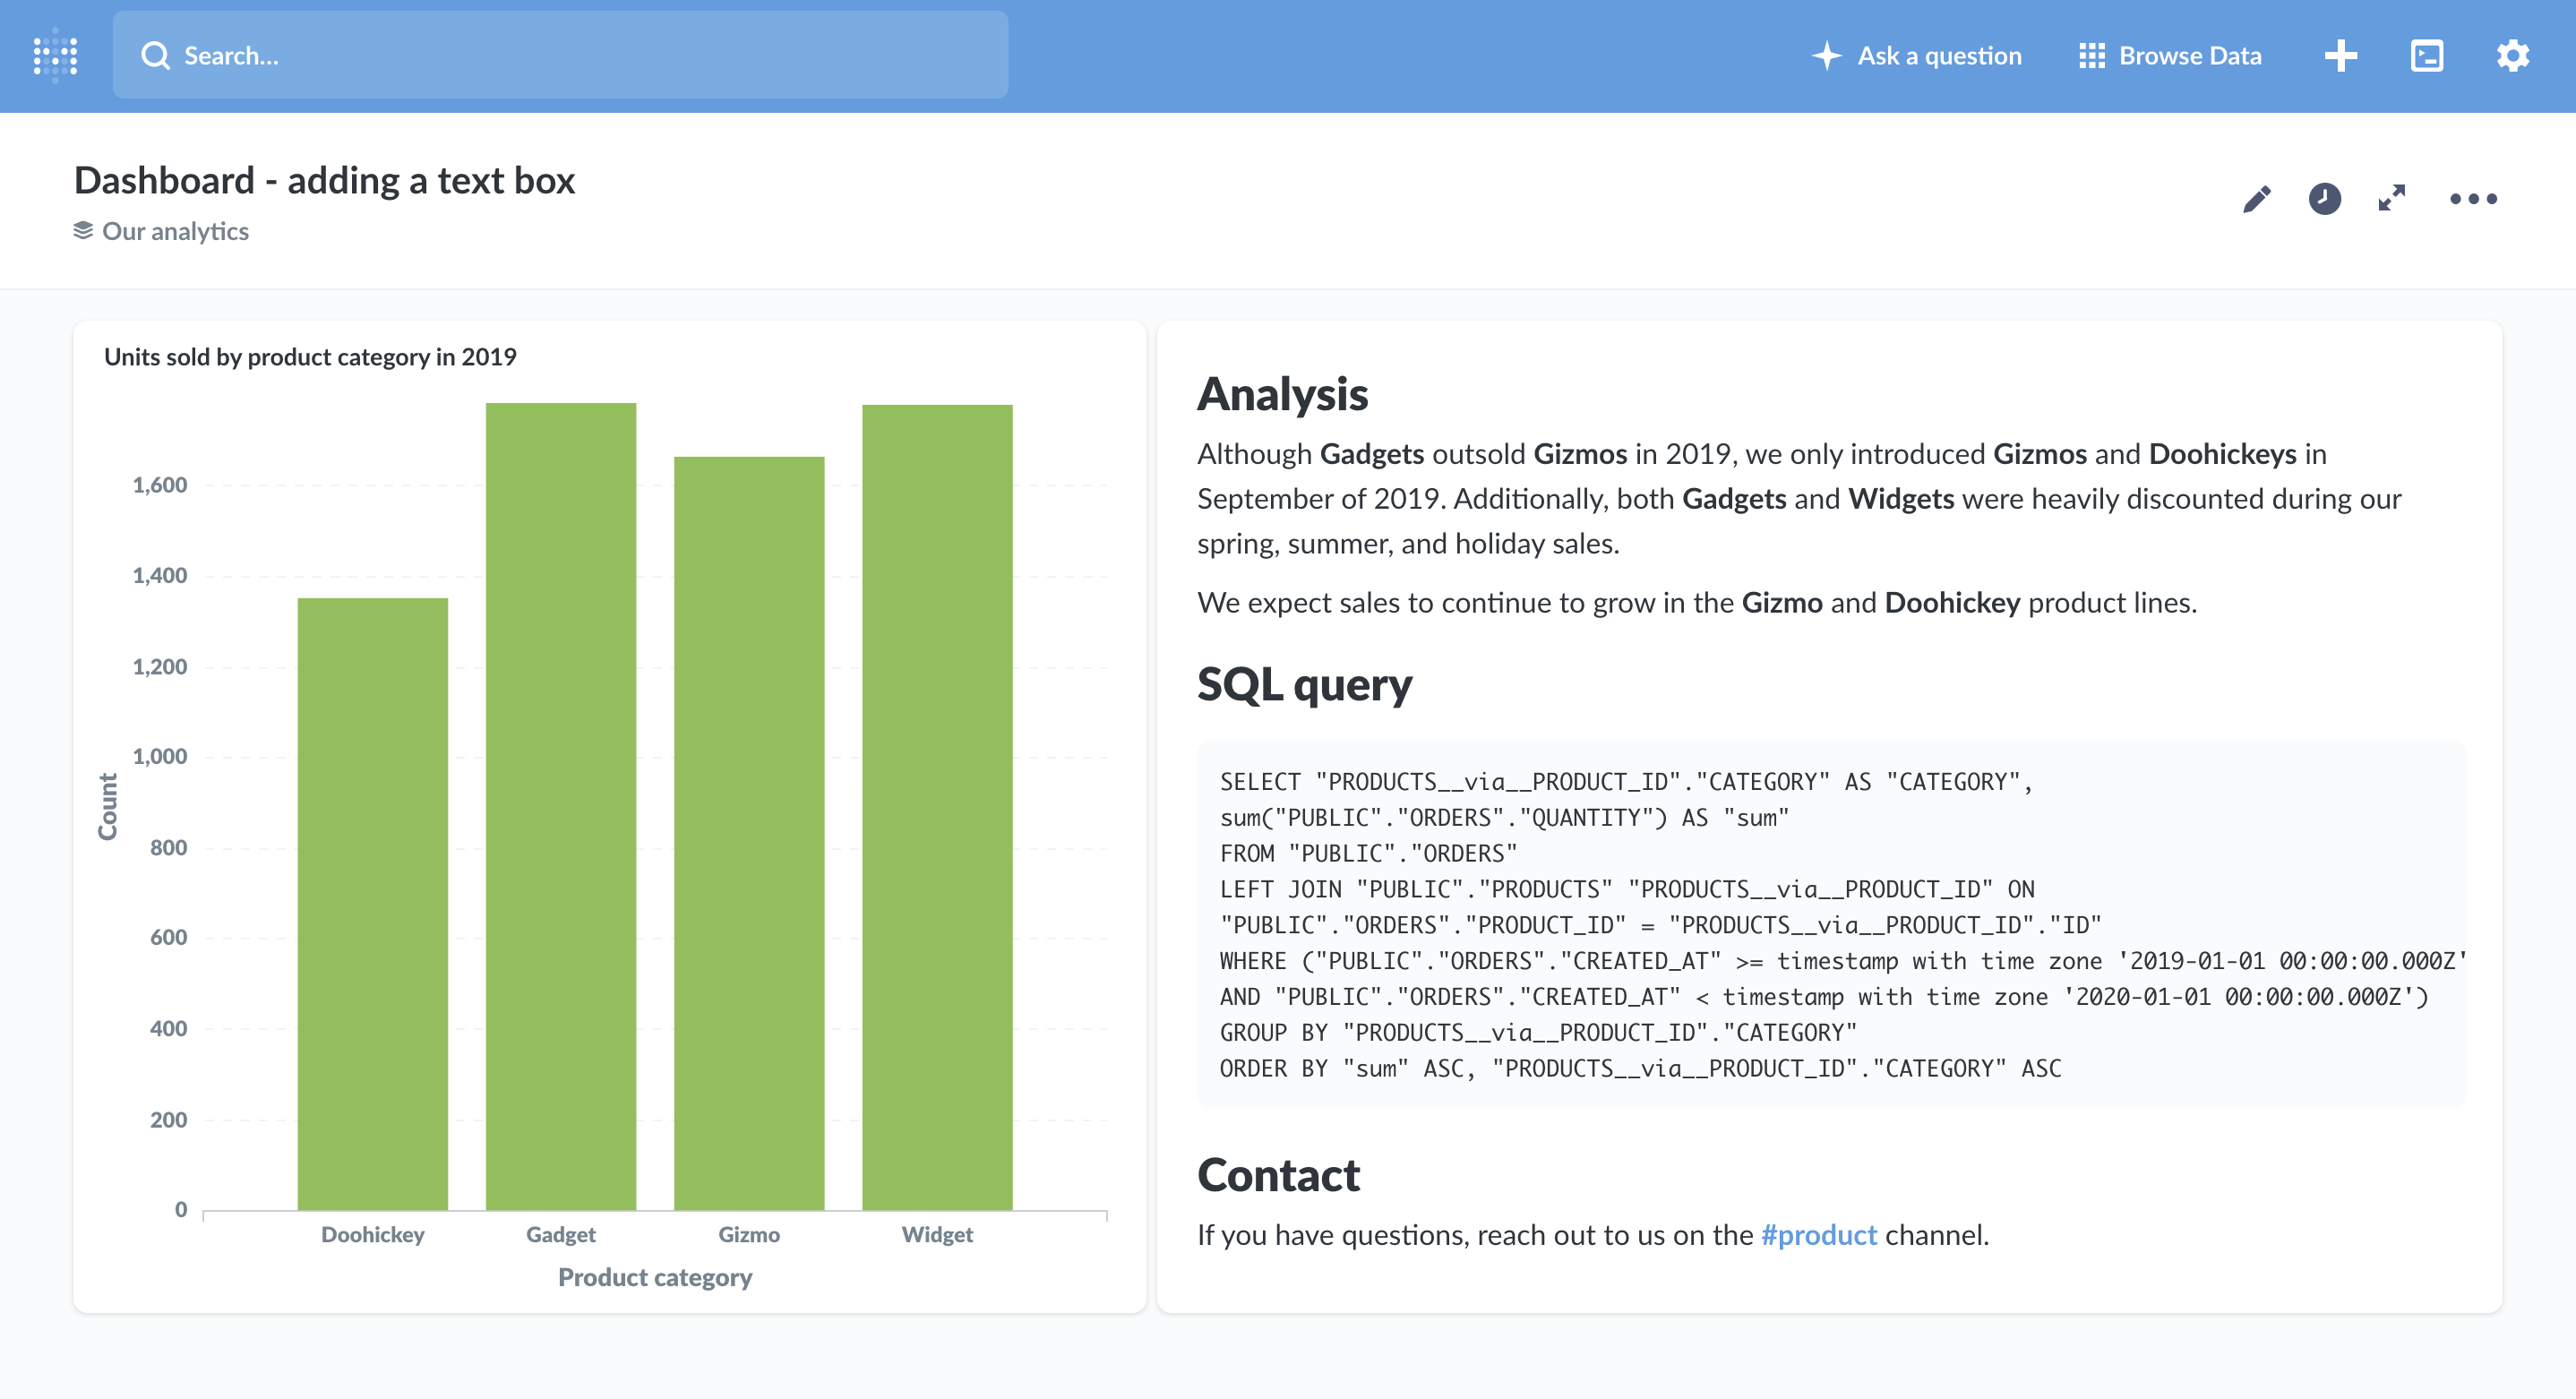
Here is the Markdown code used in the text box above:
# Analysis

Although `Gadgets` outsold `Gizmos` in 2019, we only introduced `Gizmos` and `Doohickeys` in September of 2019. Additionally, both `Gadgets` and `Widgets` were heavily discounted during our spring, summer, and holiday sales.

We expect sales to continue to grow in the `Gizmo` and `Doohickey` product lines.

# SQL query

    SELECT "PRODUCTS__via__PRODUCT_ID"."CATEGORY" AS "CATEGORY",
    sum("PUBLIC"."ORDERS"."QUANTITY") AS "sum"
    FROM "PUBLIC"."ORDERS"
    LEFT JOIN "PUBLIC"."PRODUCTS" "PRODUCTS__via__PRODUCT_ID" ON
    "PUBLIC"."ORDERS"."PRODUCT_ID" = "PRODUCTS__via__PRODUCT_ID"."ID"
    WHERE ("PUBLIC"."ORDERS"."CREATED_AT" >= timestamp with time zone '2019-01-01 00:00:00.000Z'
    AND "PUBLIC"."ORDERS"."CREATED_AT" < timestamp with time zone '2020-01-01 00:00:00.000Z')
    GROUP BY "PRODUCTS__via__PRODUCT_ID"."CATEGORY"
    ORDER BY "sum" ASC, "PRODUCTS__via__PRODUCT_ID"."CATEGORY" ASC

# Contact

If you have questions, reach out to us on the [\#product](https://fakemessageservice.com/product) channel.
The hypothetical analyst provided some context, code, and contact info: but you can include whatever context will help readers of your report.
Note: in the example above, the analyst pasted the raw SQL query generated by the query builder for reference. You can view the SQL composed by the query builder by clicking on the editor icon to “View the SQL” when in editing mode.
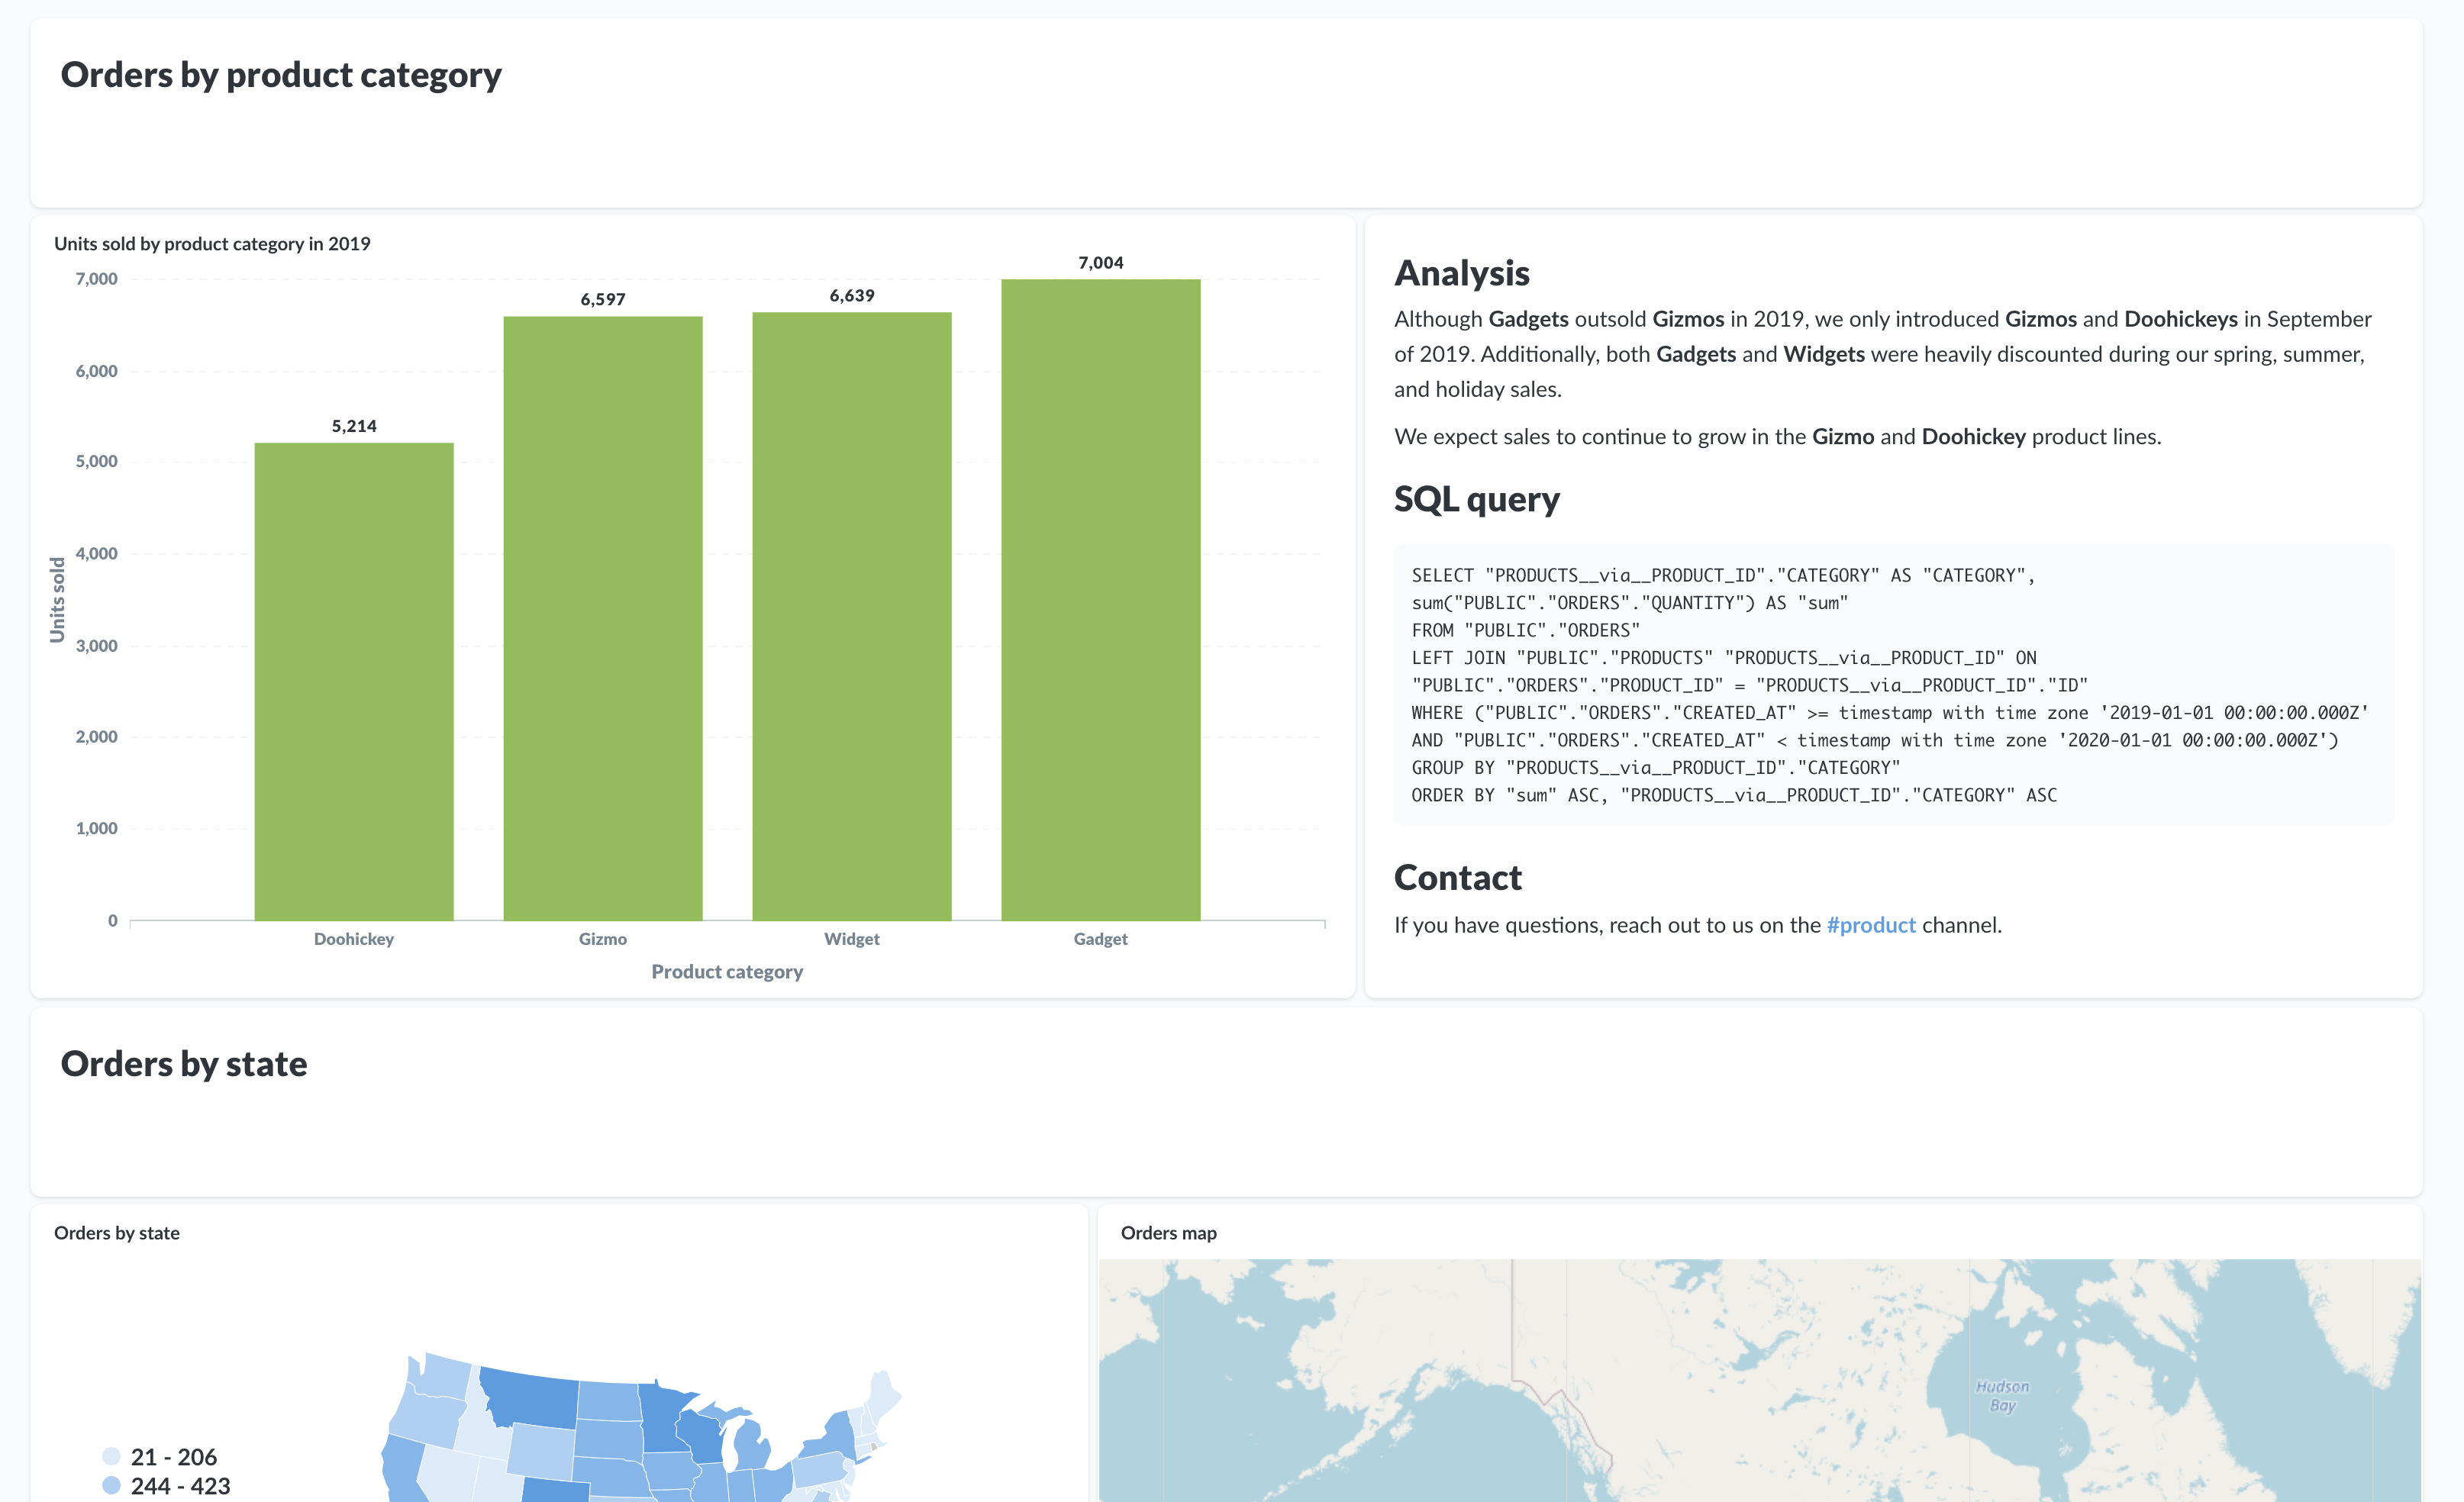
You can also use text boxes as simple dividers to keep your dashboards organized.
Use variables in text cards to create dynamic text
You can add variables to text cards and wire them up to filters. Metabase will take values selected in the filter and plug those values into variables in your text, creating text cards that update automatically when people change the filter values.
For example, let’s say you want to have a text card display the values in the Plan filter on your dashboard, like so:
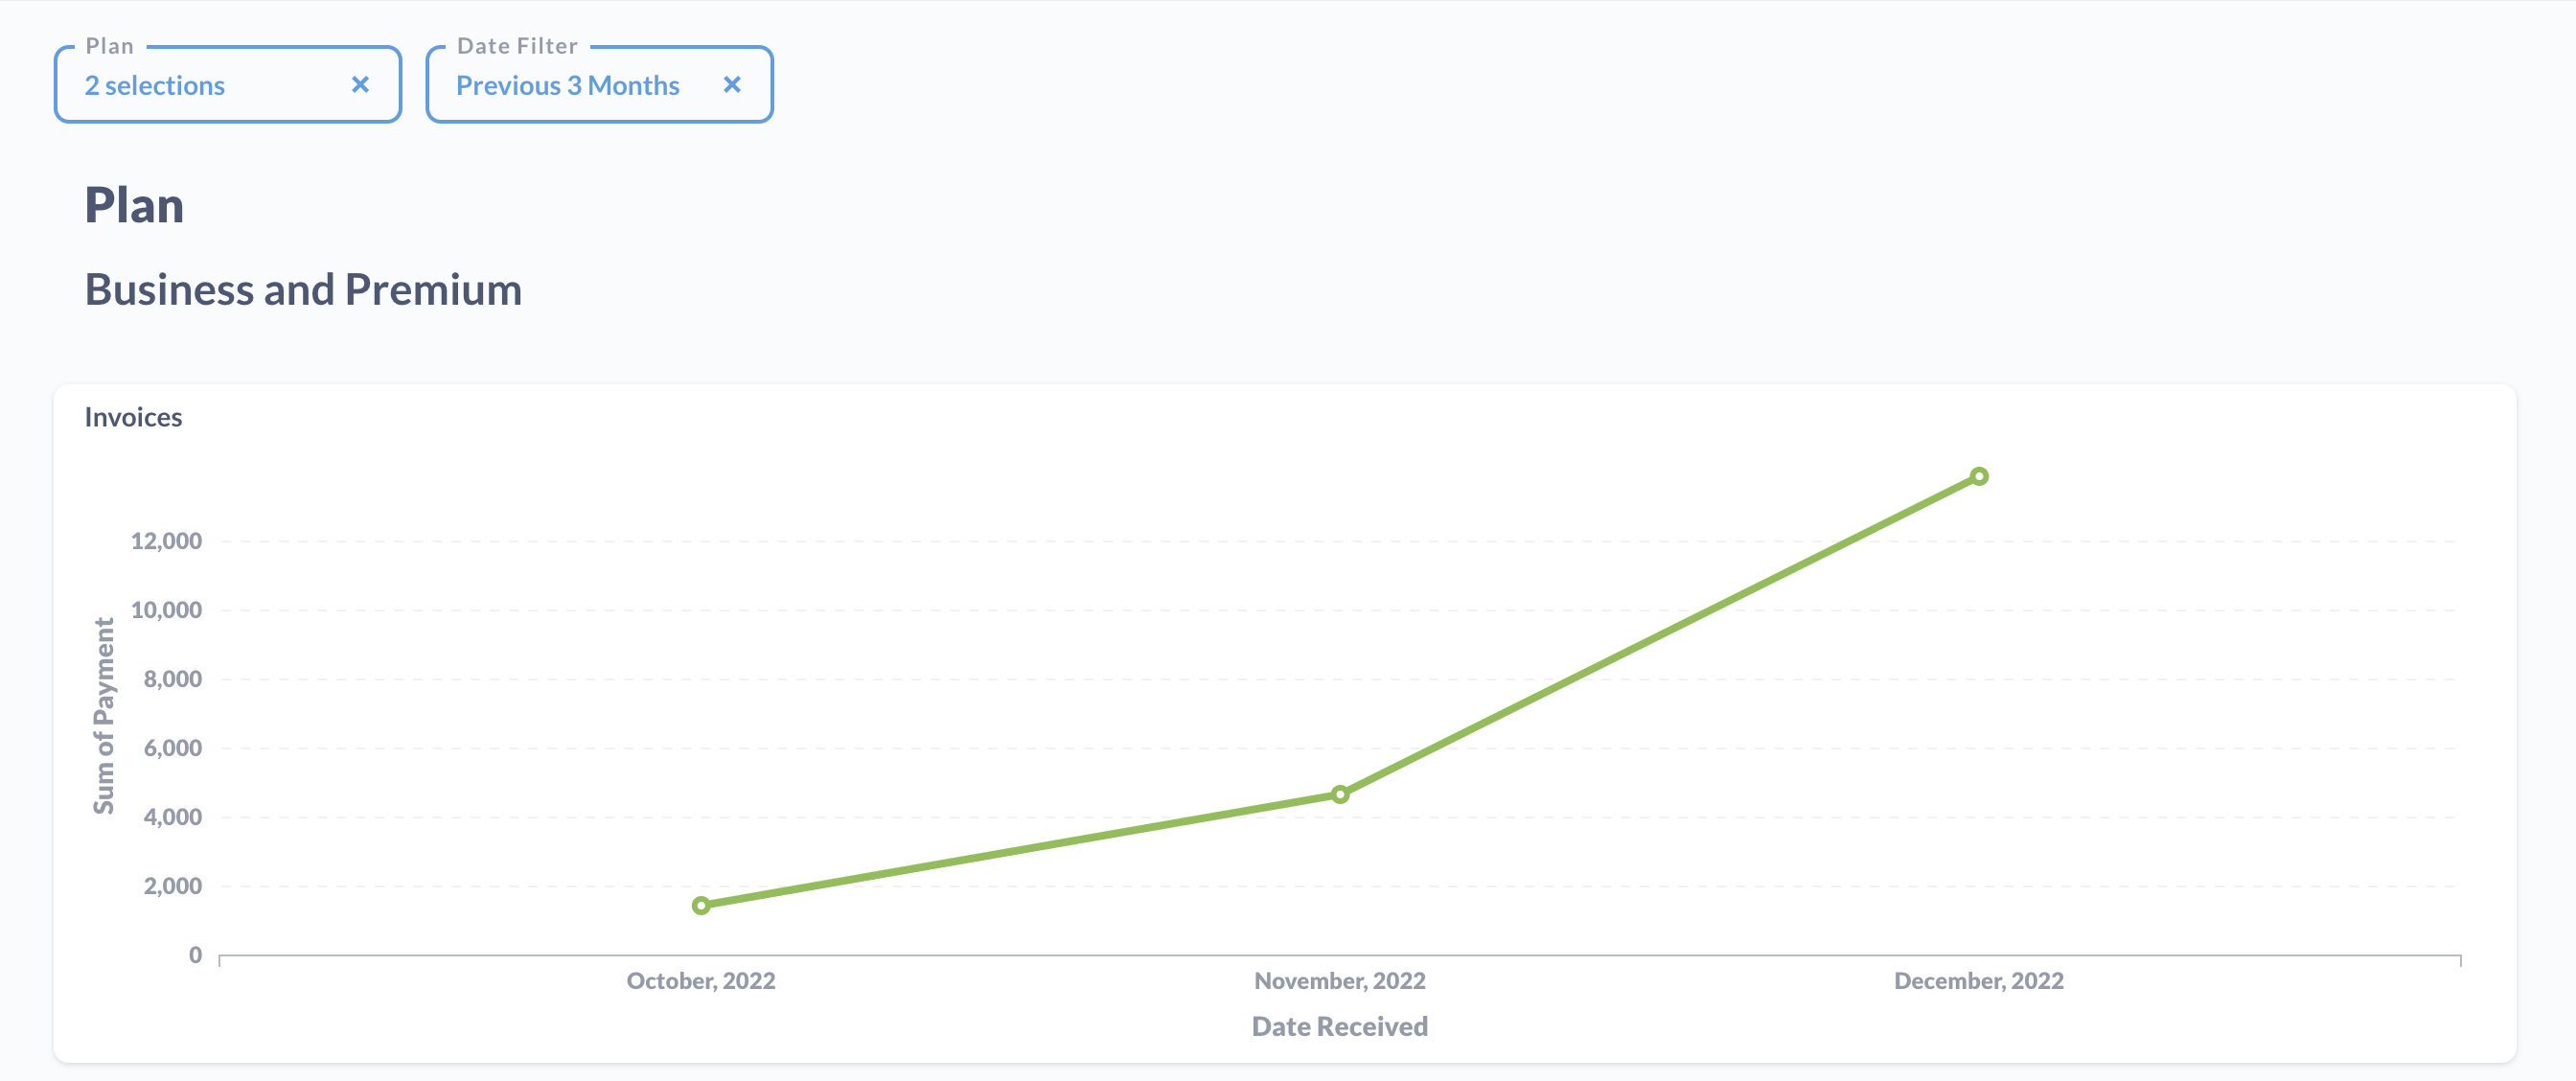
The plans listed in the text card will change depending on which plans are selected in the filter (in this case, the Business and Premium plans were selected in the filter, and so the text card displays them).
To wire up a text card variable to a filter:
- Click the pencil icon to enter dashboard edit mode.
- Add a filter to your dashboard.
- Add a text card to your dashboard.
-
Write some Markdown and include a variable. Variables are bookended with double braces:
# Plan ## {{PLAN}} - Connect the filter to the variable in the text card.
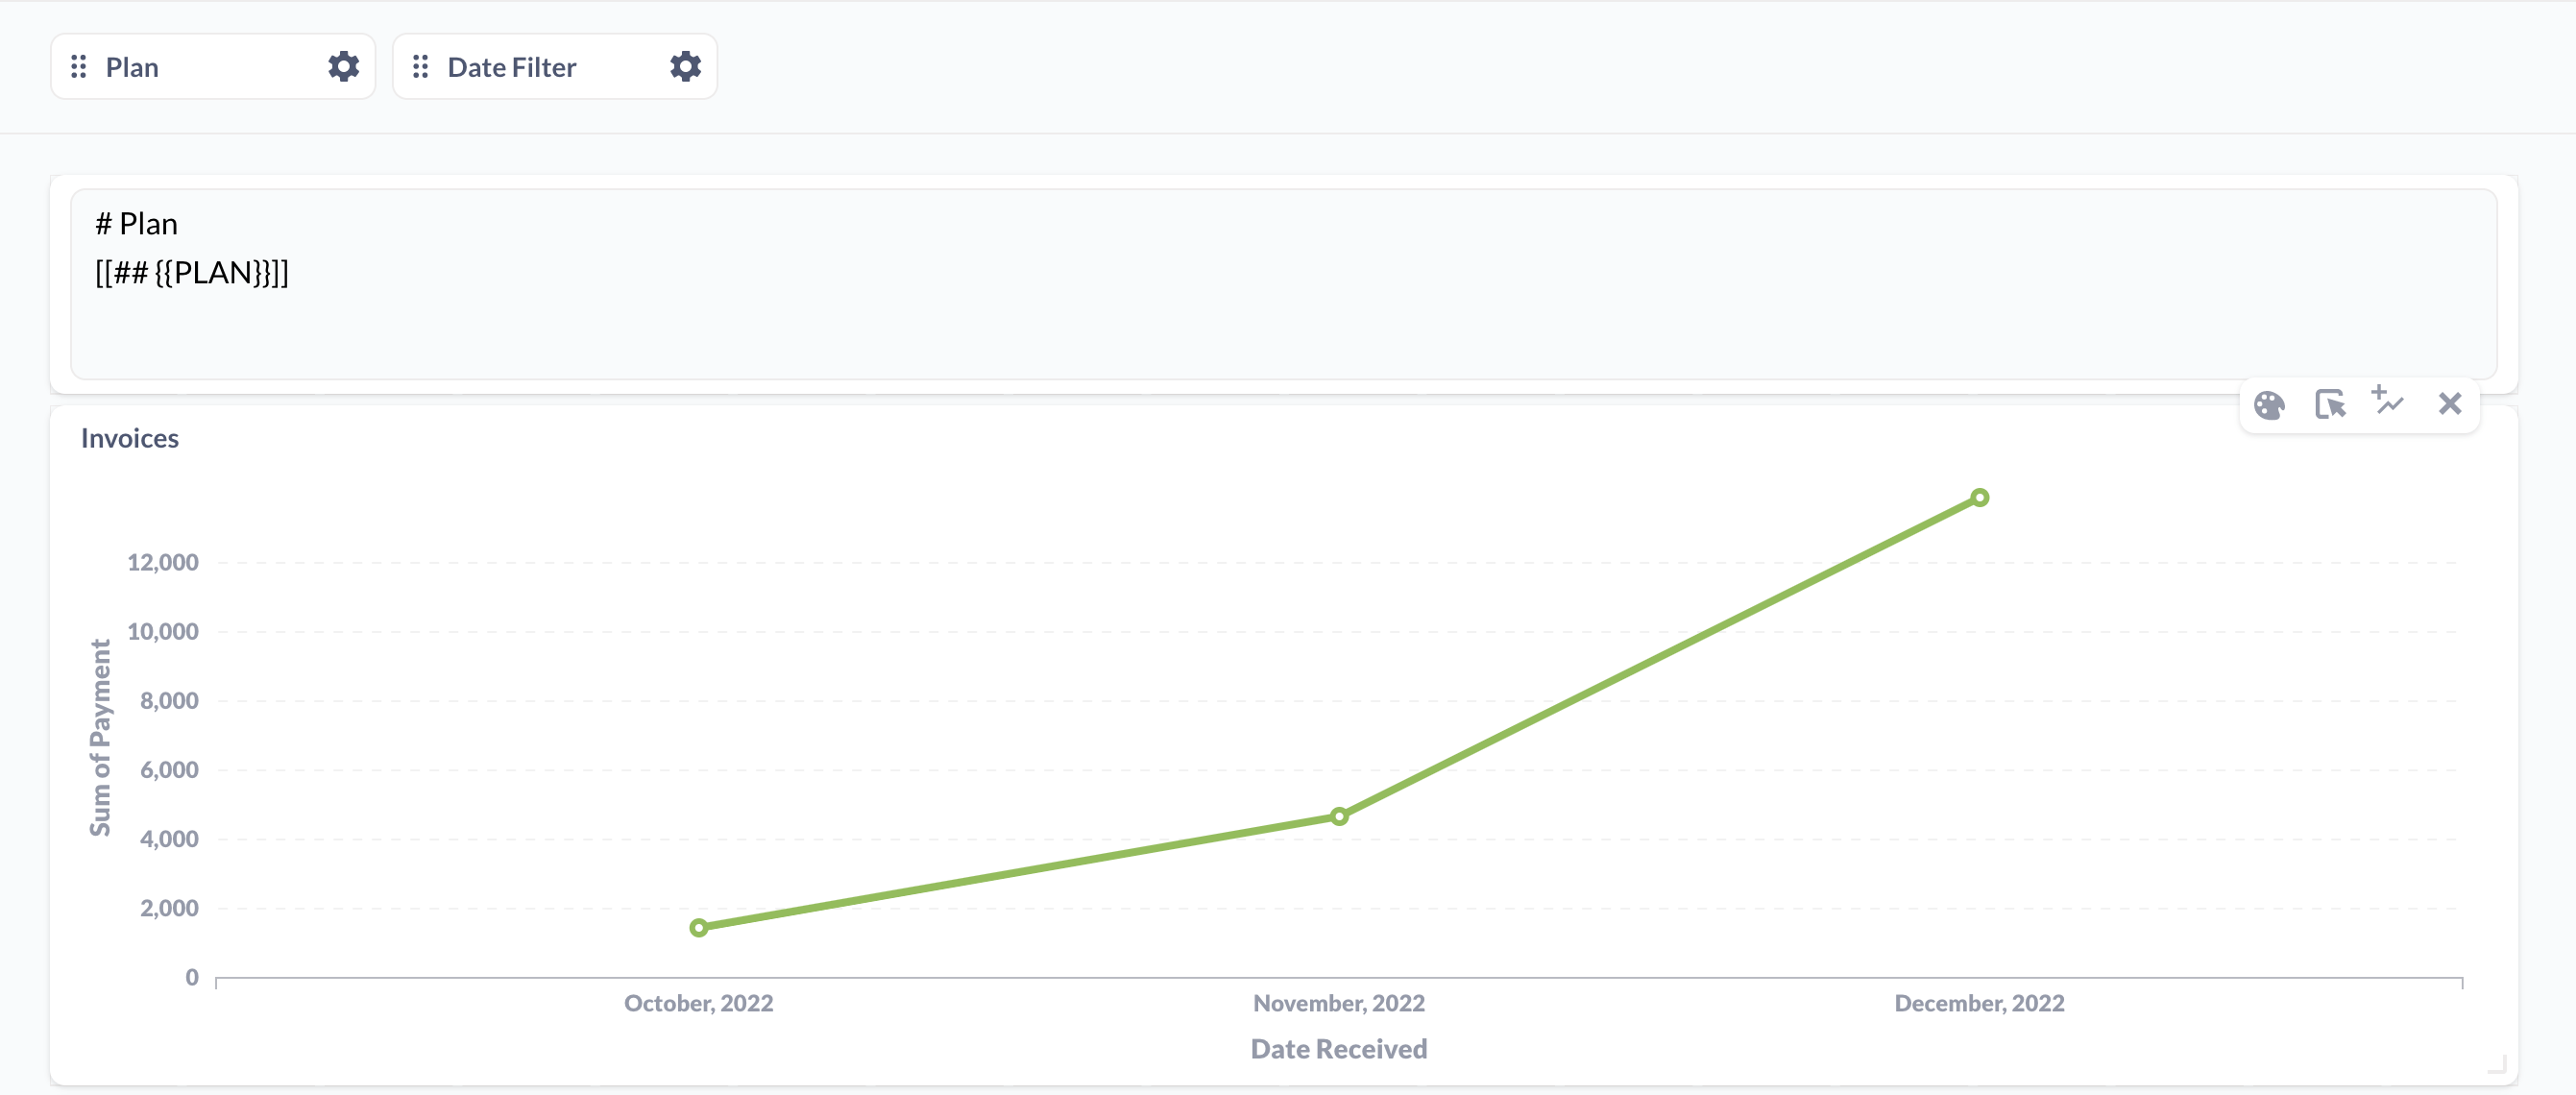
If no value is plugged into the filter, Metabase will render the unsightly {{PLAN}} variable. To handle cases where the filter has no value, you can set a default value or, better, hide the text by surrounding the variable text with double brackets to make the text optional.
# Plan
[[## {{PLAN}}]]
The double brackets tell Metabase to display the text only if the connected filter has at least one value.
Create a custom URL with a filter value
You can add a URL to a Markdown card like this:
[Google Search](https://google.com)
which will show up as the clickable hyperlink: Google Search.
To make a dynamic URL, such as a Google Search for “filter value”, you can put a {{variable}} wherever you want the filter value text to show up. For example, to add a dynamic URL to a dashboard with the Invoices table:
- Create a dashboard filter for “Plan”.
-
Add a Markdown card with your URL and variables:
[[ [Google Search for "{{plan}}"](https://google.com/search?q={{plan}}) ]] - Connect the “Plan” filter to the Markdown card.
- Optional: set a default value for the “Plan” filter.
The outer double square brackets in the Markdown card text will hide the URL by default when the filter is empty (no value selected and no default value set).
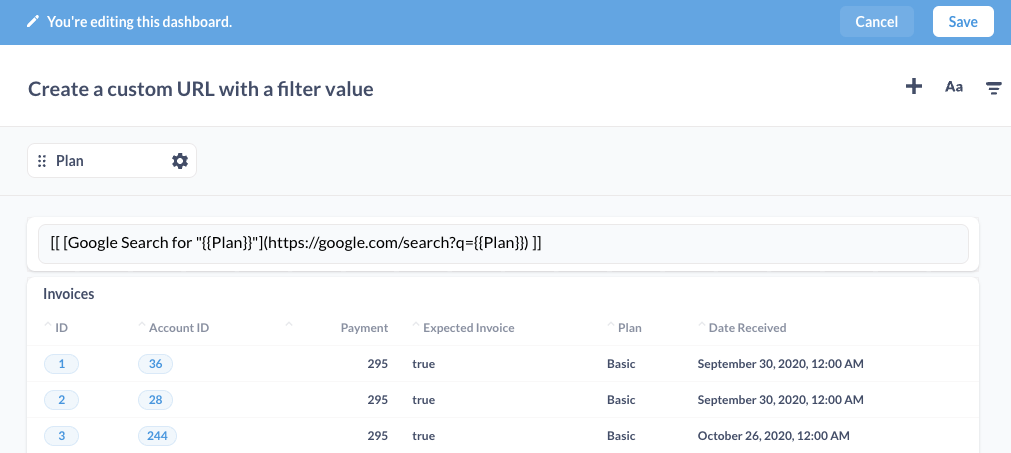
Now, if someone goes to the “Plan” filter and selects “Basic”, they’ll see a clickable link in the Markdown card like this: Google Search for “Basic”.
Custom URL with a sandboxing attribute
Data sandboxing is only available on Pro and Enterprise plans (both self-hosted and on Metabase Cloud).
Say you have a “department” attribute and you want to create a custom link to a user guide like this:
[View Marketing guide](https://your-company-wiki.com/marketing)
To display custom URLs based on a person’s sandboxing attribute:
- Create a dashboard filter for the sandboxing attribute.
-
Add a Markdown card with your URL and variables:
[[ [View {{department}} guide](https://your-company-wiki.com/{{department}}) ]] - Connect the filter to the Markdown card.
To hide the URL by default when the filter value is empty, make sure to include the outer double square brackets in the Markdown card text.
When a sandboxed user views the dashboard, they’ll see:
- View Marketing guide.
- A filter widget with the value “Marketing” (and no other selectable options).
- Dashboard data that’s sandboxed on rows where “Department = Marketing”.
If your dashboard is a static embed, you can opt to hide the filter widget.
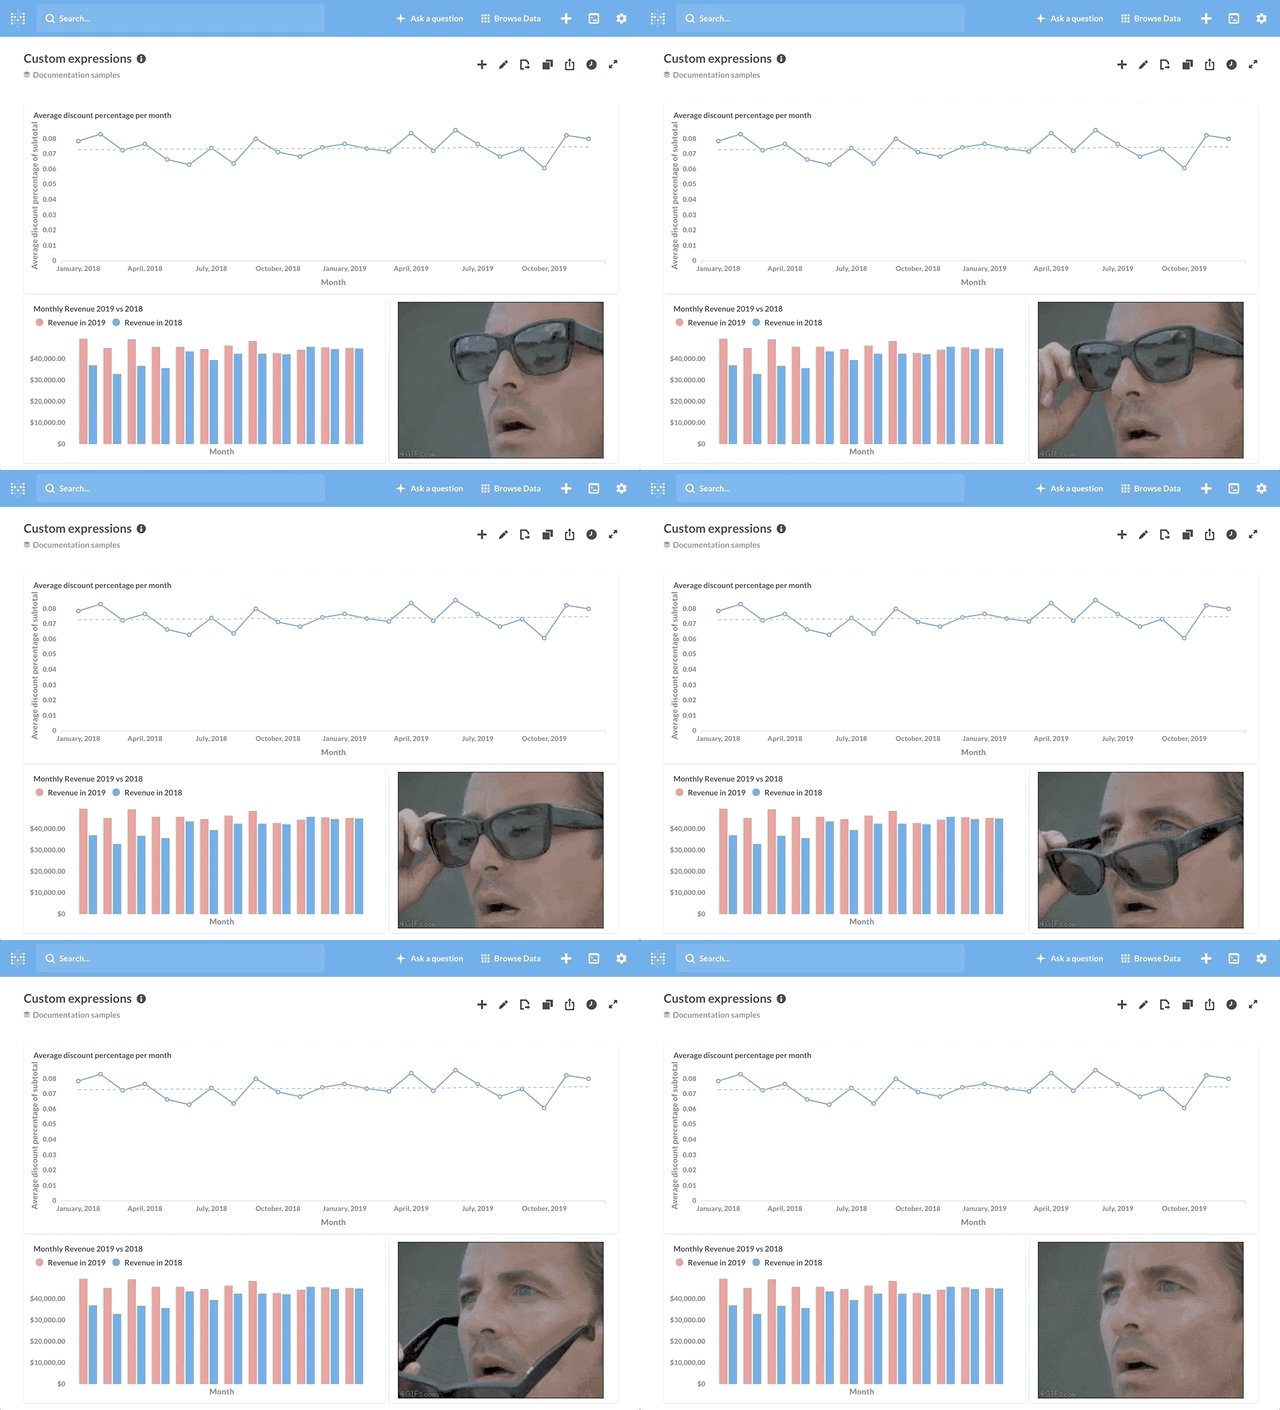
One last pro tip for GIF aficionados
The image syntax,

also works for GIFs. Because there are far more important use cases for dashboard text boxes:
Happy Markdowning!
Next: Build a record lookup tool with Metabase
How to use Metabase to build an internal lookup tool to quickly find details about your customers, orders, or other data.


