Multi-level aggregation
How to ask questions with multiple parts using the query builder.
Many analytics questions can be answered with just four steps:
- Join a couple of tables to get all the required information in one place.
- Filter the data so that it only includes the values that are relevant.
- Group and aggregate those values to create the insight you need.
- Visualize the result so that you can understand what your data is telling you.
Queries don’t have to stop there, though: Metabase allows you to add more filters and calculate more summaries step by step. To see how this works, let’s trace the steps an analyst might go through while exploring how many items of each category are sold weekly.
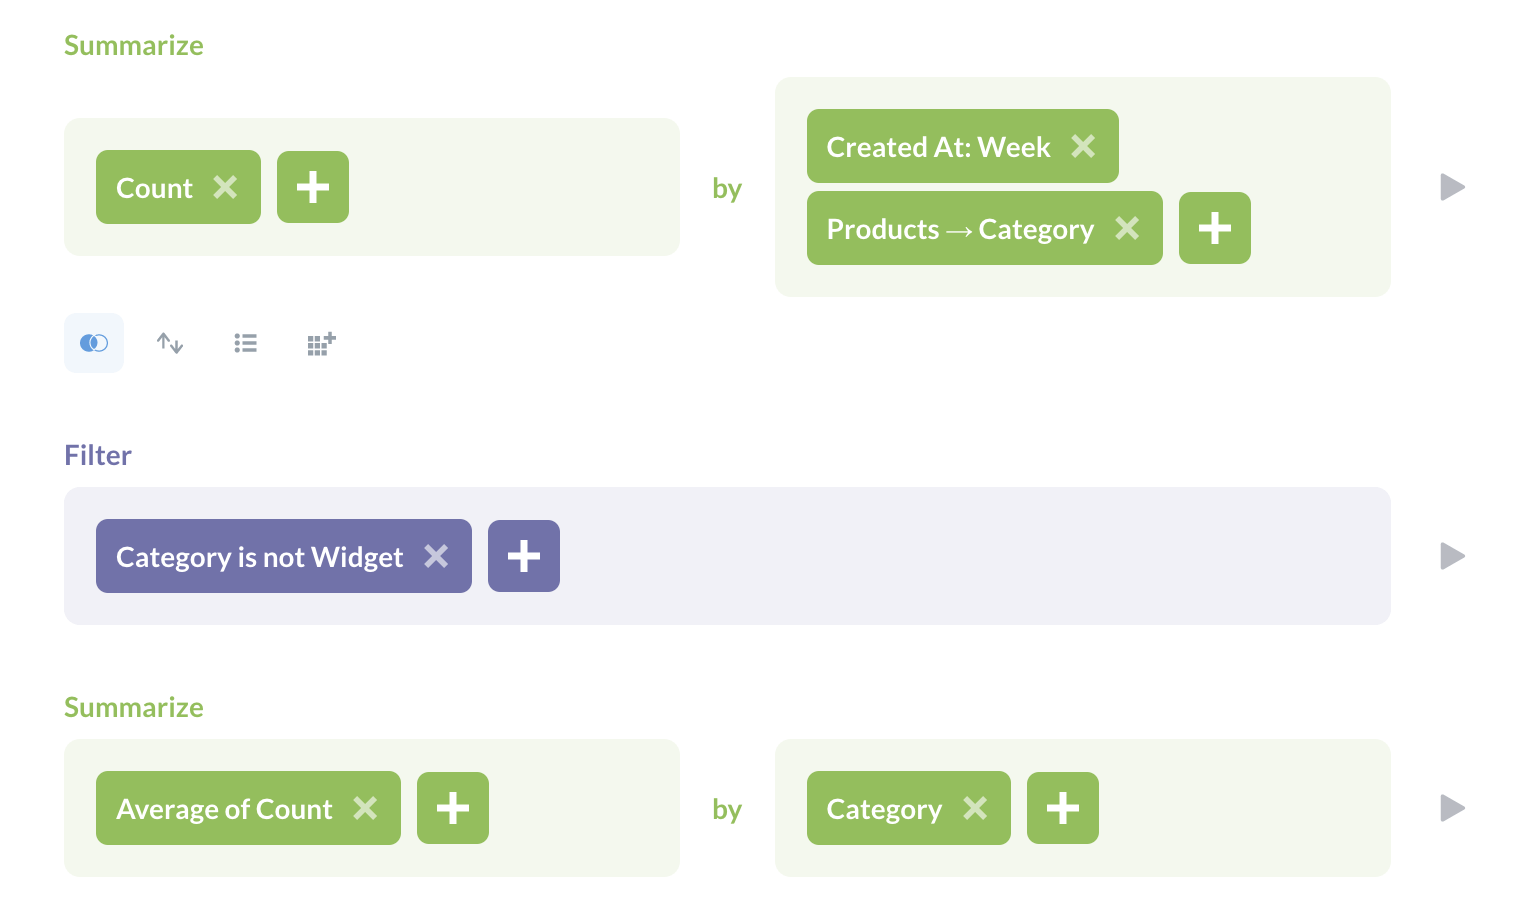
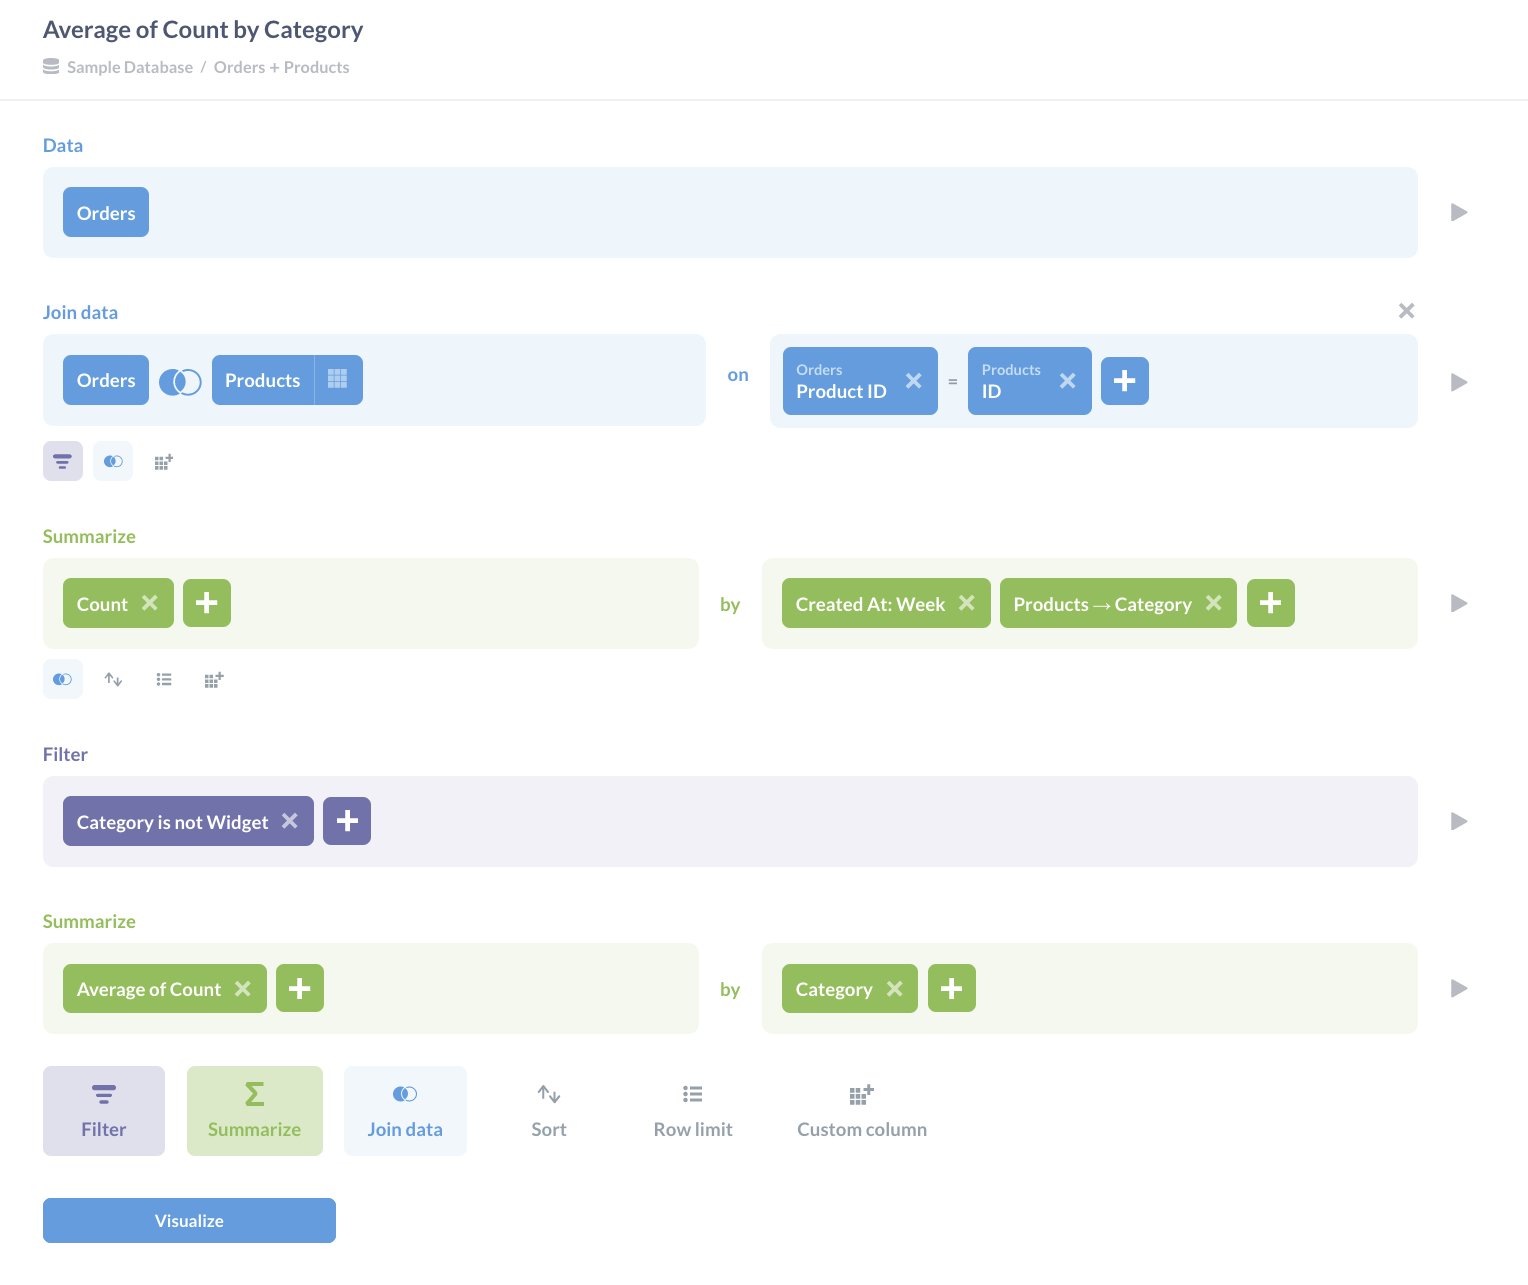
We start by counting the number of items sold each week in each product category in the Sample Database. Information about sales are in the Orders table, and product categories are in the Products table, so we join those by matching product IDs. For the moment we want to know about all product categories, so we don’t need to filter this data, but we do need to group it and summarize it to calculate weekly totals by category.
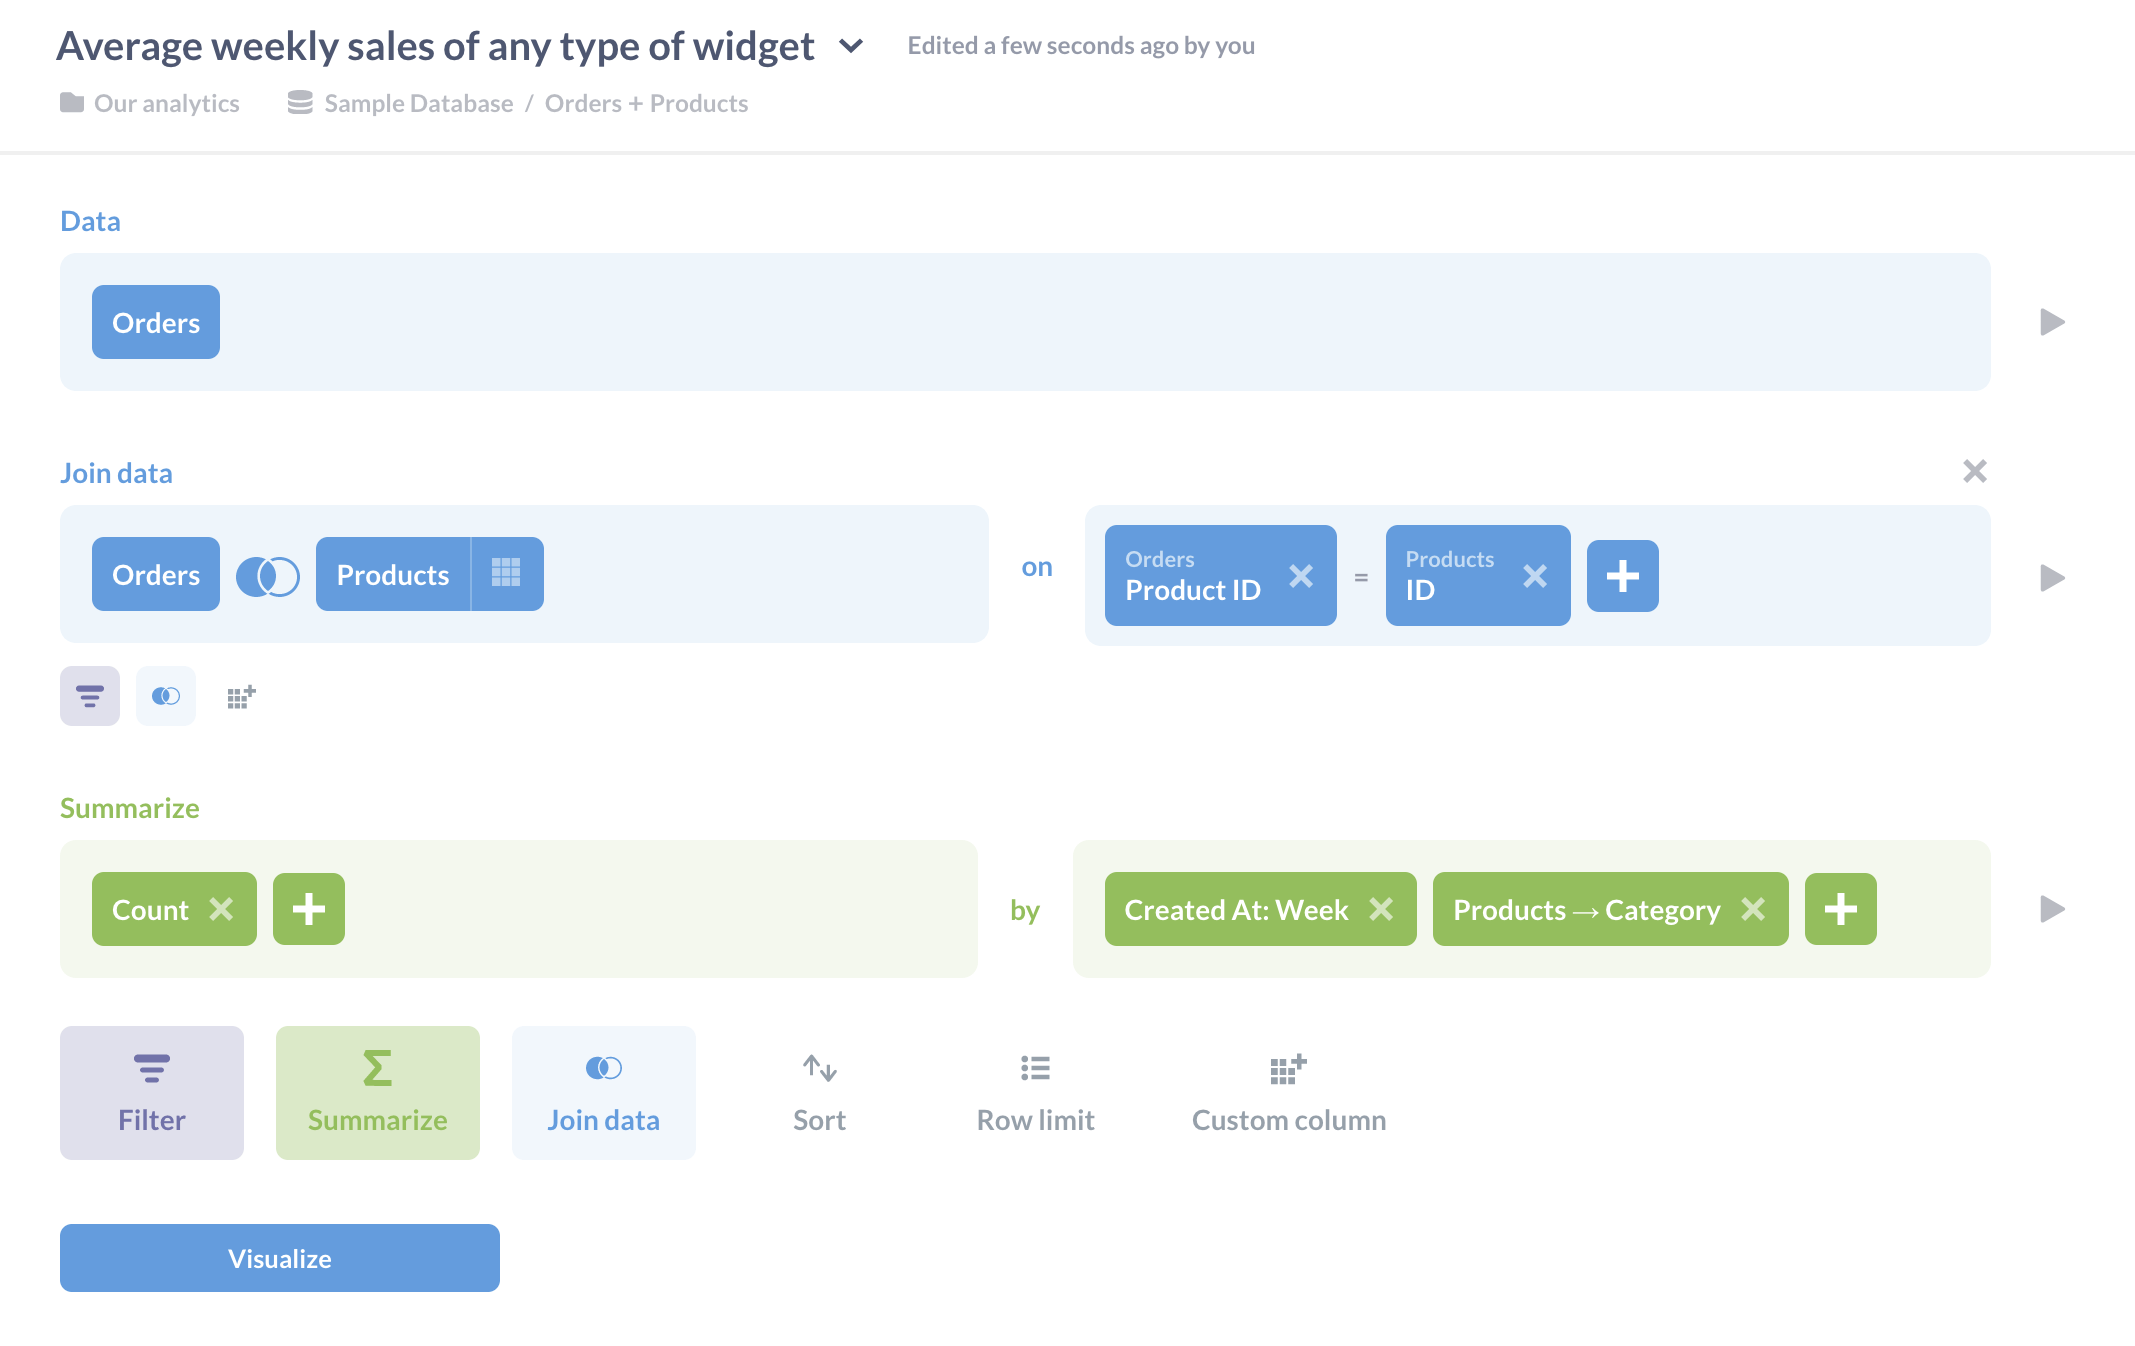
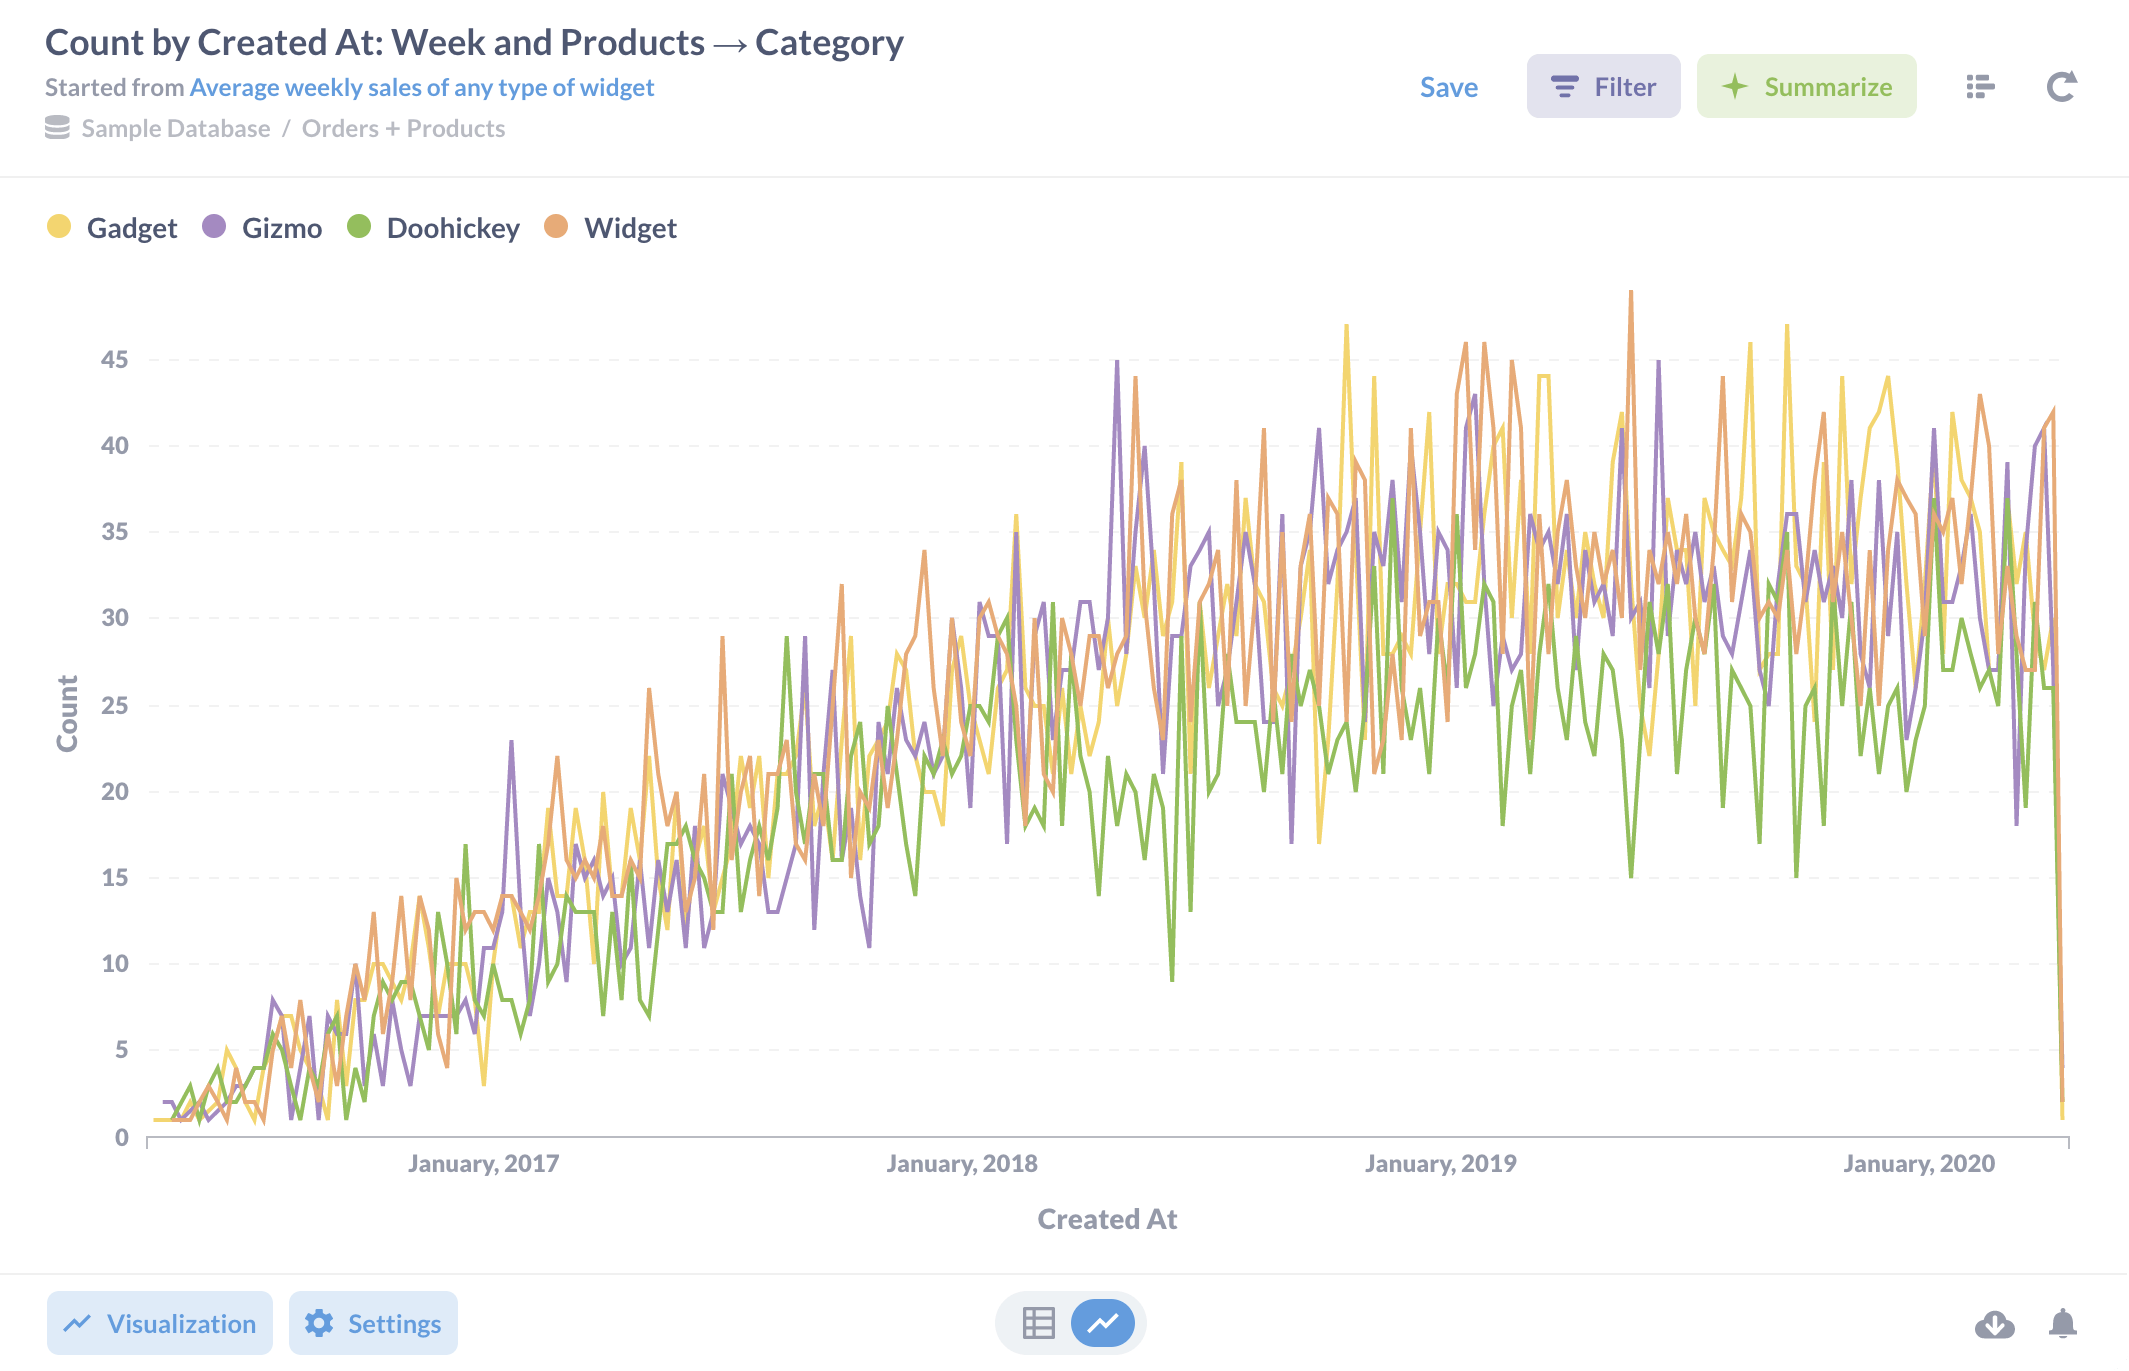
We can visualize the result so far as a time series) line chart to get insight we didn’t have before.
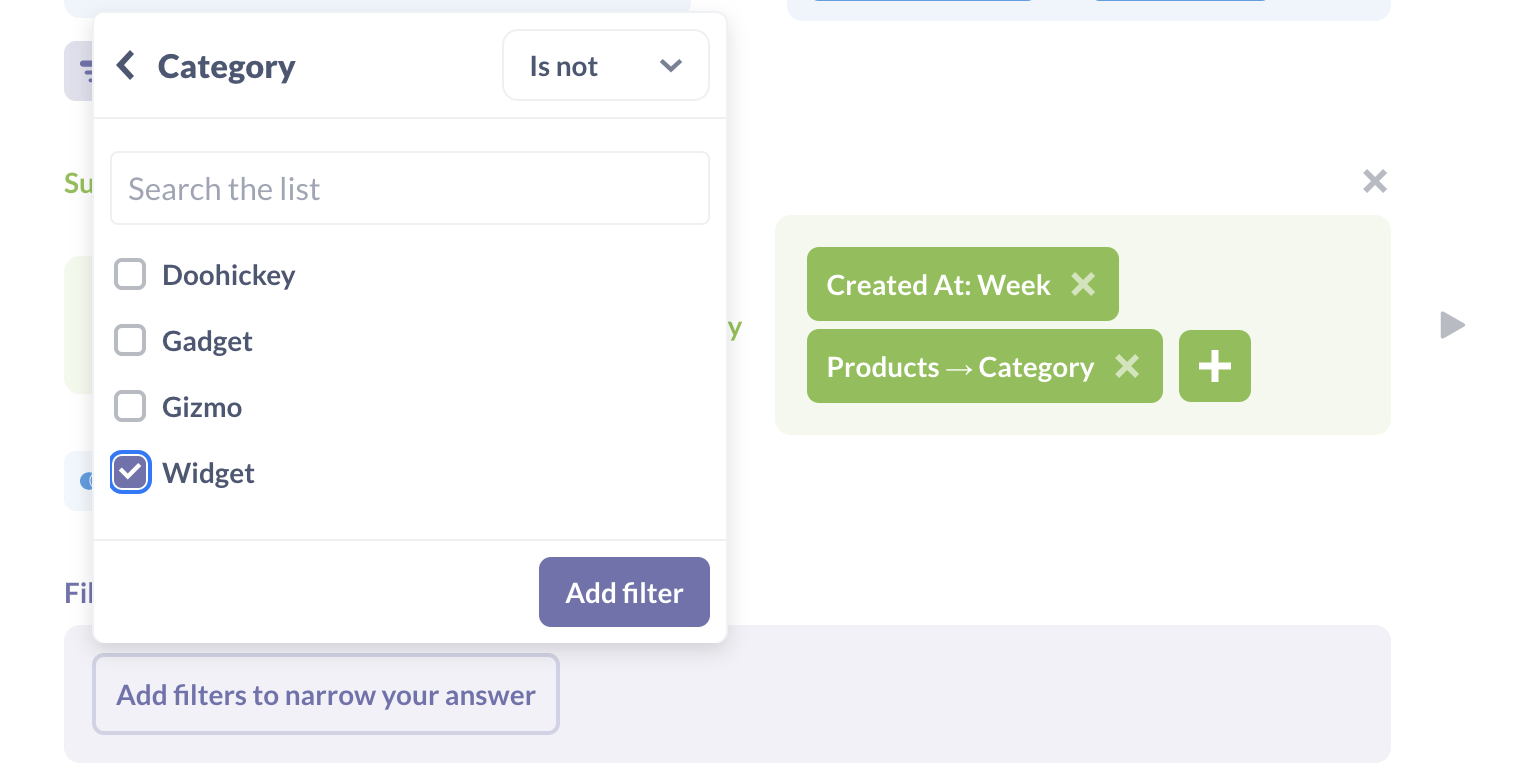
However, let’s go further and add another filter after the summary step to take widgets out of our data. When we return to the query builder and click the Add Filter button at the bottom of the editor, it shows us the three columns in the summarized data: Created At, Category, and Count. A few clicks lets us create a filter that removes rows whose category is widget.
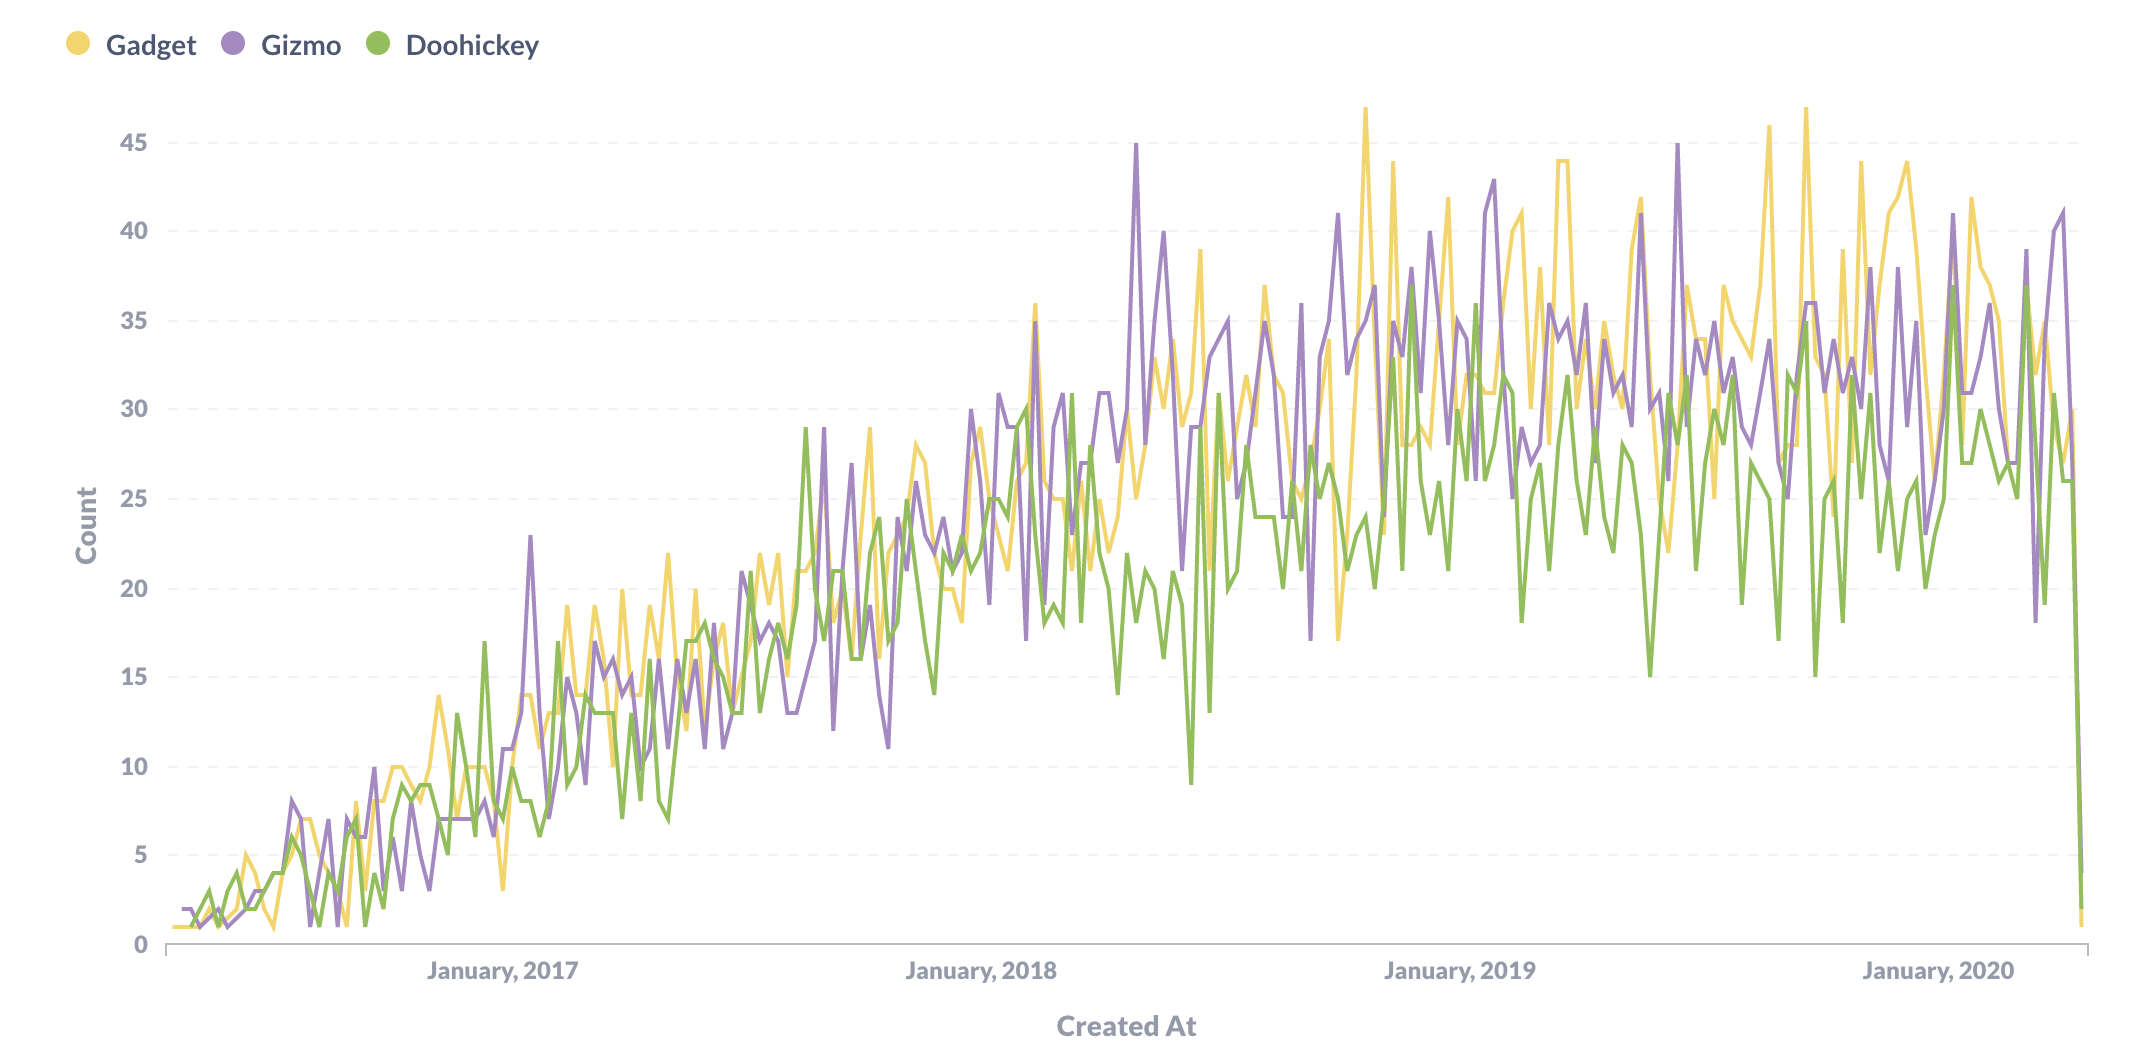
If we save the filter and visualize the data, we’ll get a table of results. If you select the line chart from the visualization settings, the chart now only shows lines for the three product categories we are interested in.
Now suppose we want to know the average number of products of each of these three categories that were sold weekly. We’ve already calculated the weekly sales by category, so all we have to do is return to the query builder, click the Summarize button, choose Average, and then tell Metabase that we want to average the Count grouped by Category.
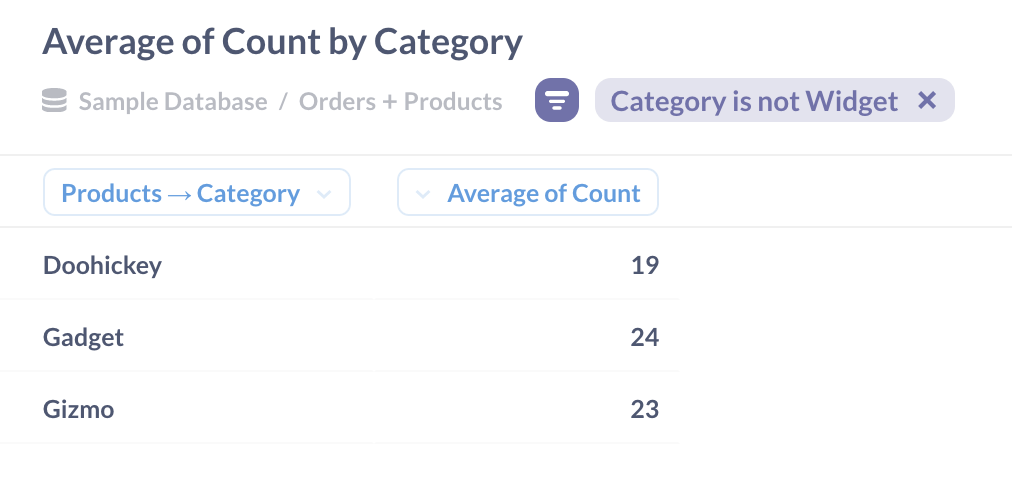
Our visualization is now exactly what we want: the average number of doohickeys, gadgets, and gizmos sold each week.
The full question that produces this table:
There are other ways to calculate this result: we could, for example, filter out the widgets before we calculated the first summary (which most analysts would consider a best practice, since reducing the size of the data set early on improves performance). The important lesson is that we can construct insight step by step as each answer leads to a new question, and that Metabase allows us to add operations one by one as they occur to us. We don’t have to plan everything in advance: if we find that we are always starting with the same operations, we can save those separately, as explained in the article Snippets vs. Saved Questions vs. Views.
Next: Searching in tables
Learn how to search within your SQL questions and simple questions using filters and custom expressions. Finding words or phrases in your tables is now easier than ever.


