

These are the docs for the Metabase master branch. Some features documented here may not yet be available in the current release. Check out the docs for the current stable version, Metabase v0.59.
Tables
Tables are data’s natural habitat.
Rearranging, adding, and hiding columns
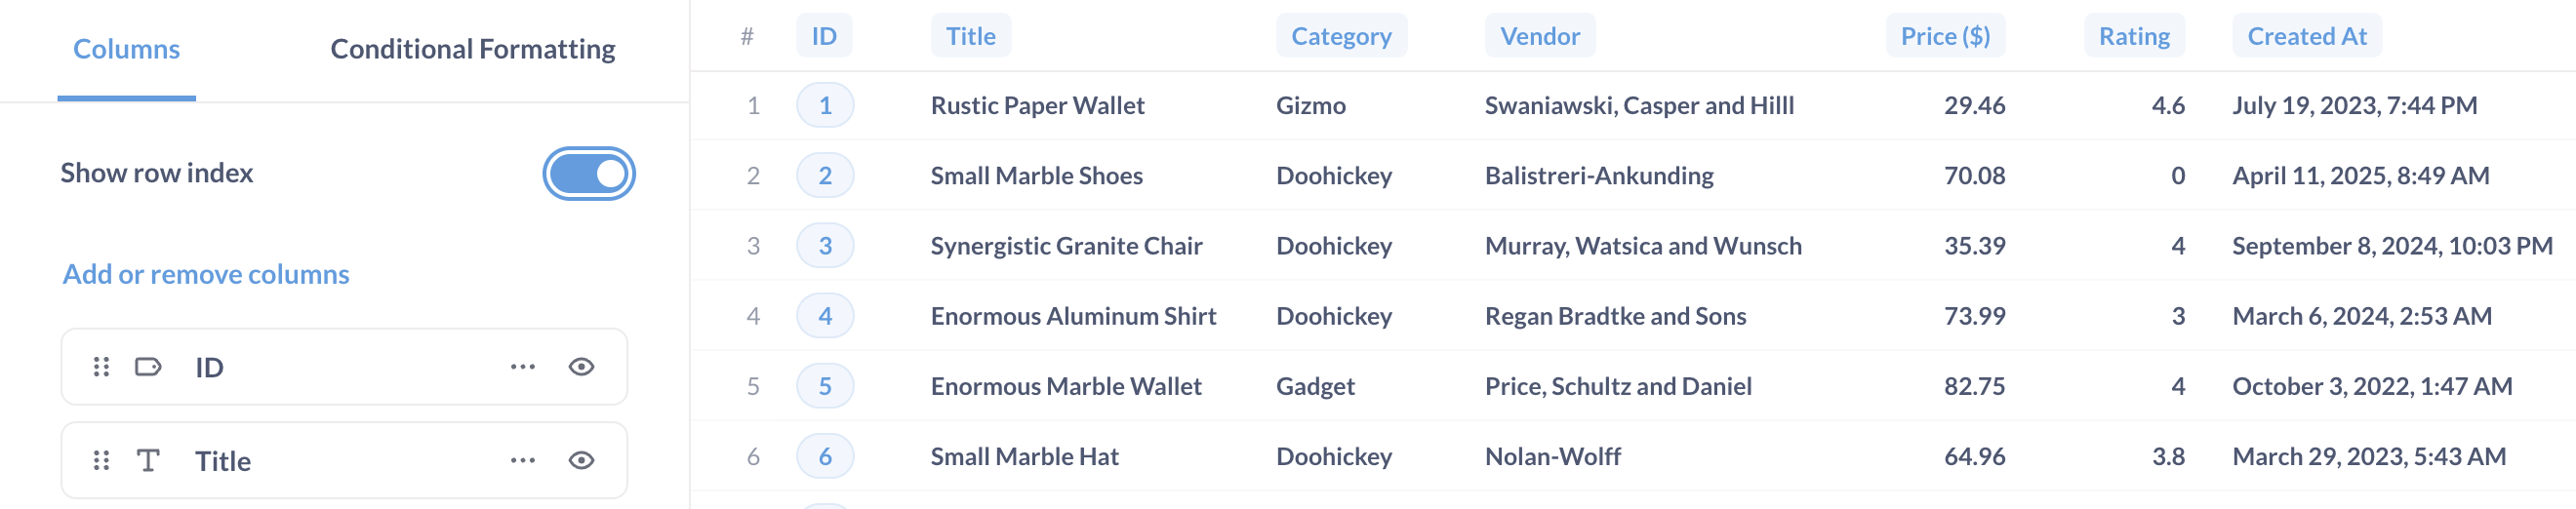
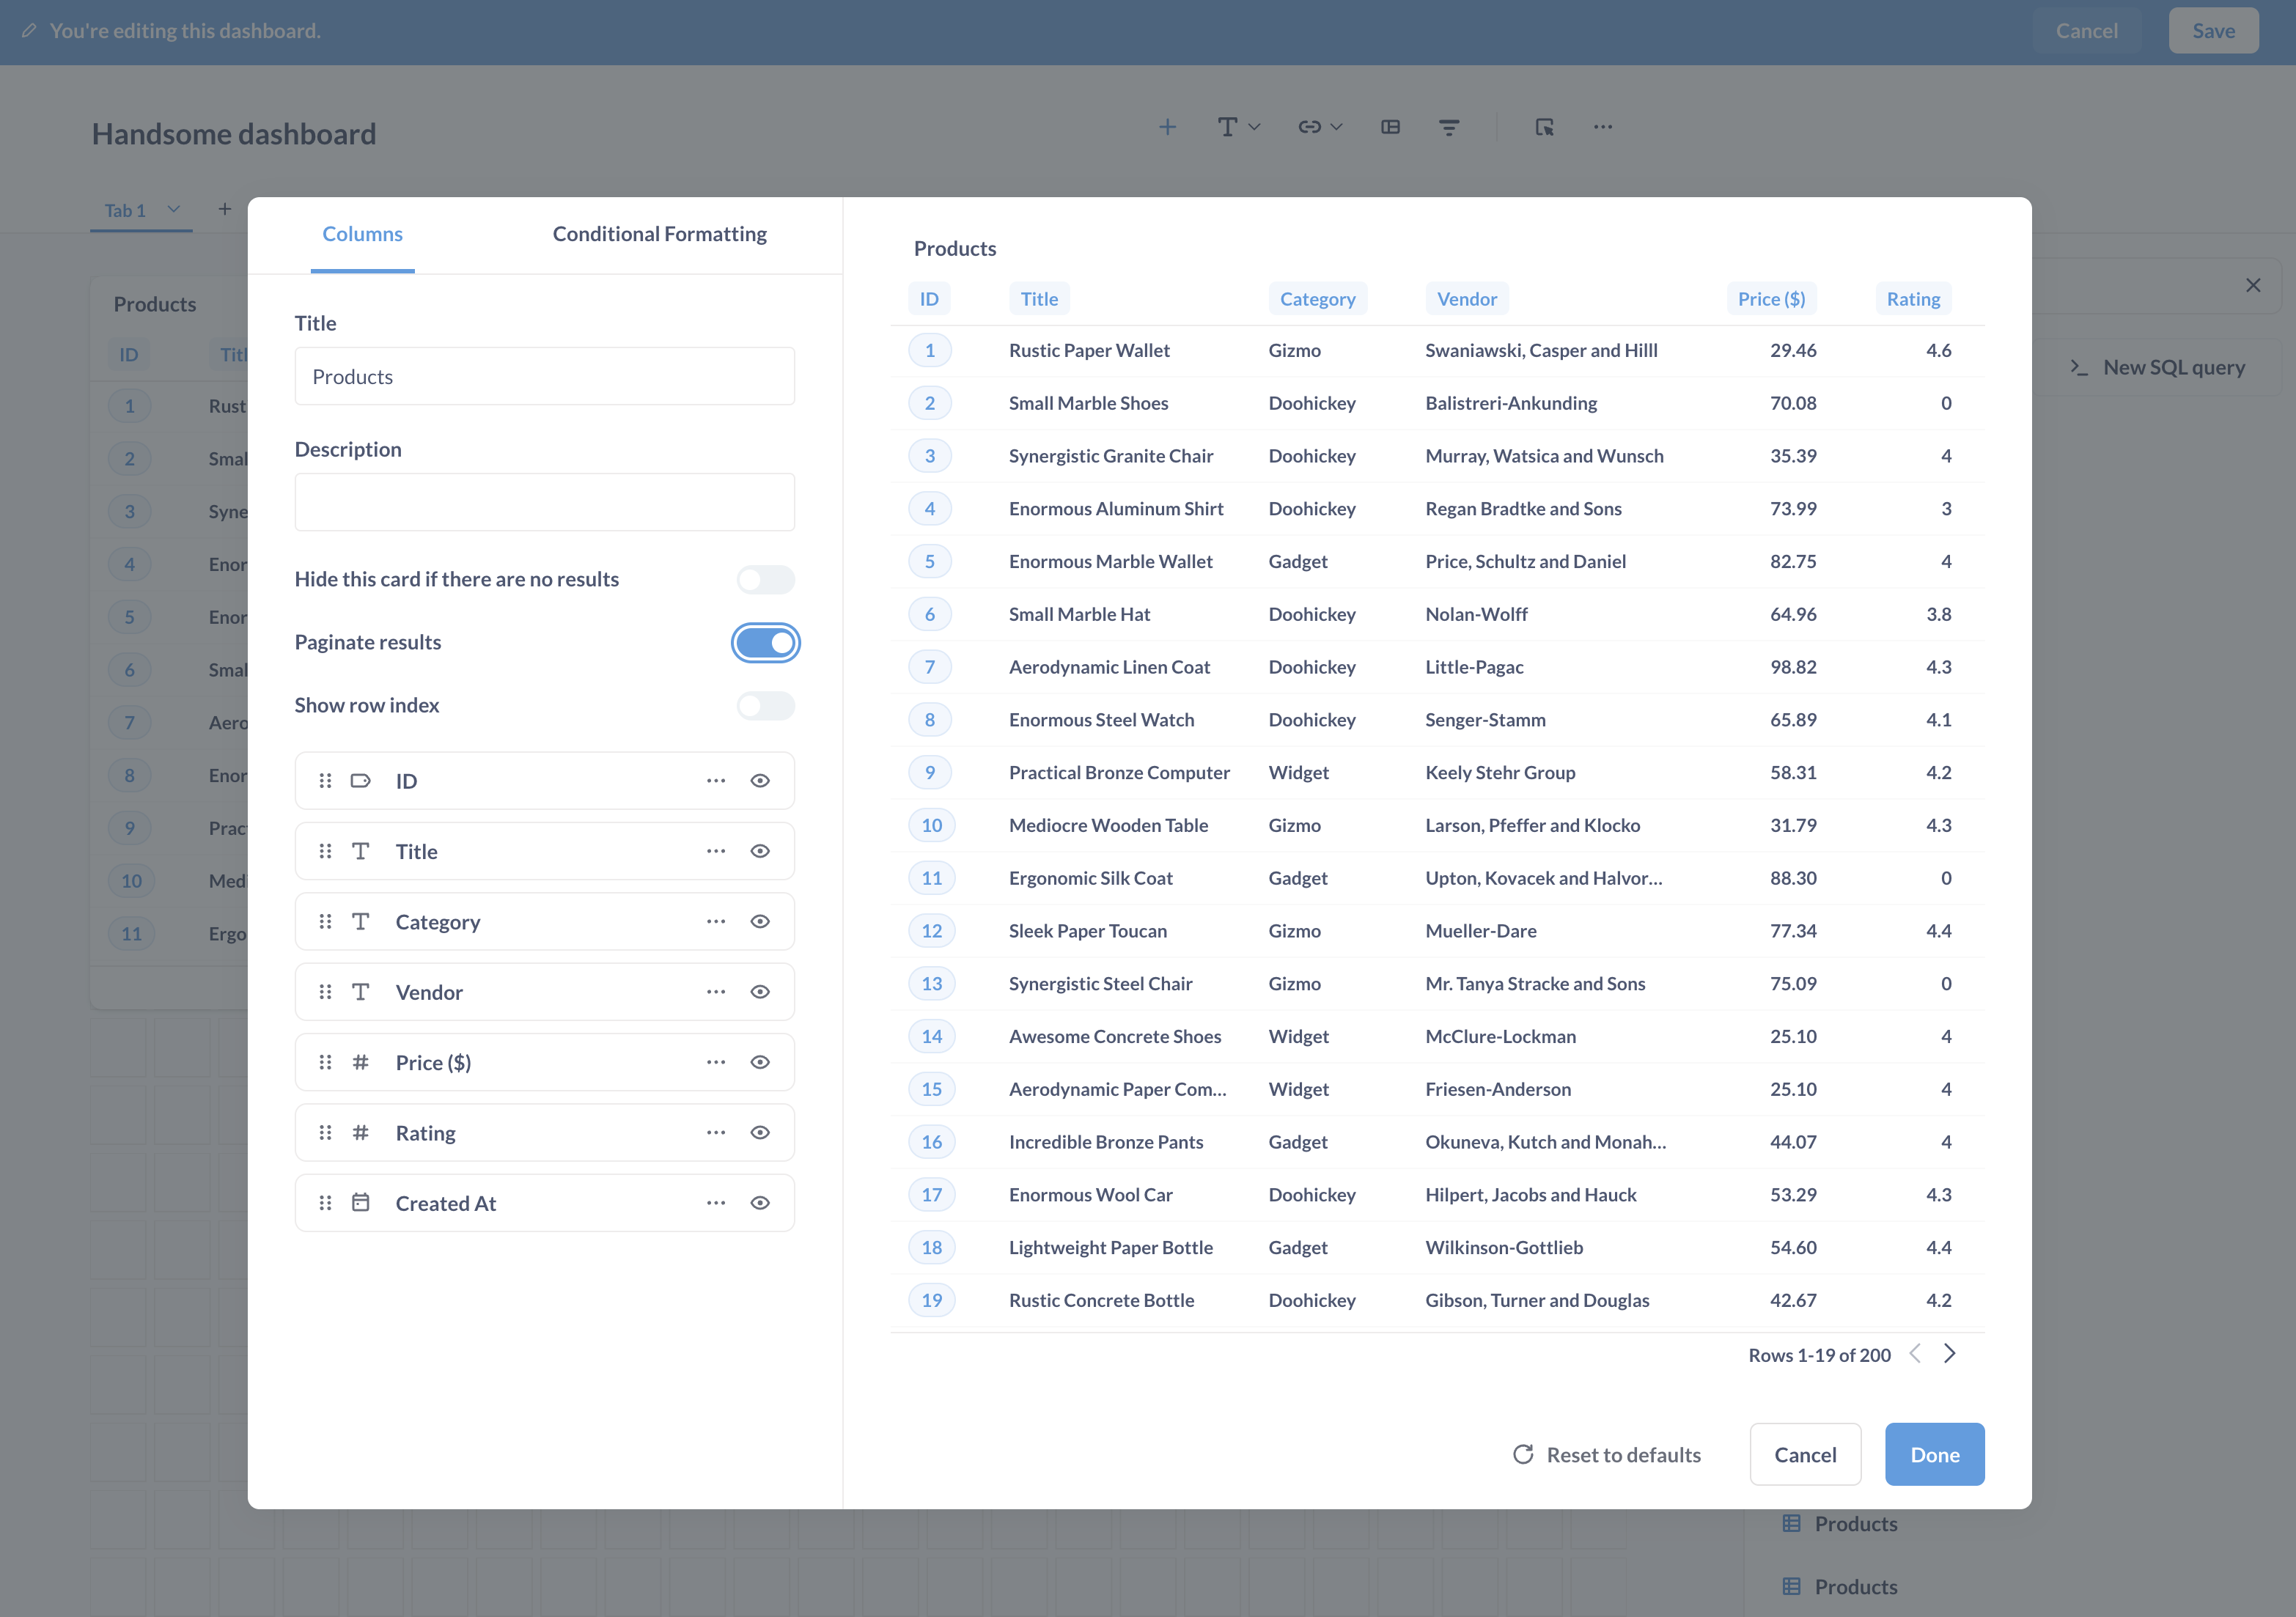
Open up the settings for your table visualization and you’ll see the Columns tab, which displays all the columns currently being shown in the table. To hide a column, click the eye icon.
To manage these columns, including columns from linked tables, just click add or remove columns. Check the boxes next to the columns you want to show in the visible section, or uncheck to hide them.
When viewing tables, you can click on the gear icon in the bottom left to bring up the columns picker. Click Add or remove columns to search for and pick columns, including columns from related tables.

Admins (and people in groups with access to table metadata) can hide columns across your entire Metabase by marking them as hidden in the table metadata settings.
Hiding columns should not be used to secure sensitive information. Hiding columns in table visualization settings only affects the visibility of the columns in the visualization, not in the query results. Even people with view-only permissions to the question will be able to change the visualization settings and unhide columns. To exclude a column from the results of a specific query, uncheck the column in the “Data” block of the query builder.
To rearrange the order of the columns, simply click and drag any of the columns in the sidebar. You can also click on a column’s heading in the table and drag the column to another position in the table.
Custom columns
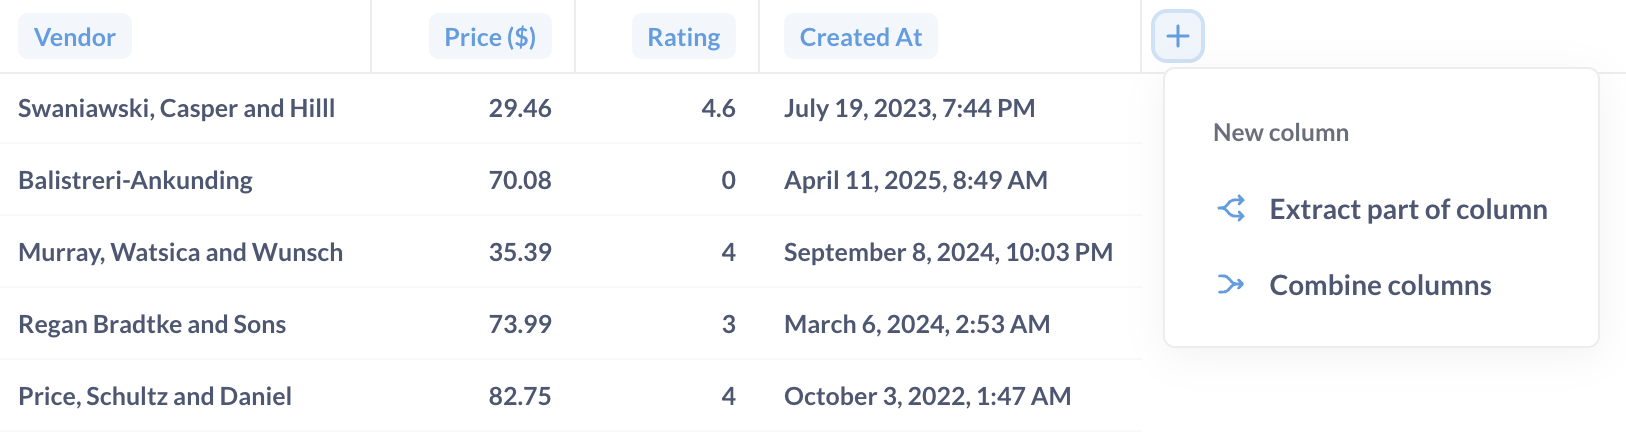
To add a column, you can click the + button in the upper right of the table. From here you can:
- Extract part of column (like extracting part of a URL or date)
- Combine columns (like concatenating columns for first name and last name)
For more complicated calculations, you can use the editor to add a custom column.
Add row numbers to a table
To number the rows of a table, click on the gear icon in bottom left to bring up the table formatting sidebar. In the Columns tab, and toggle on Show row index. Metabase will add a column to the left of the table displaying a number for each row.
Resize columns
To change the width of a column, you can click and drag the edges of the column’s header.
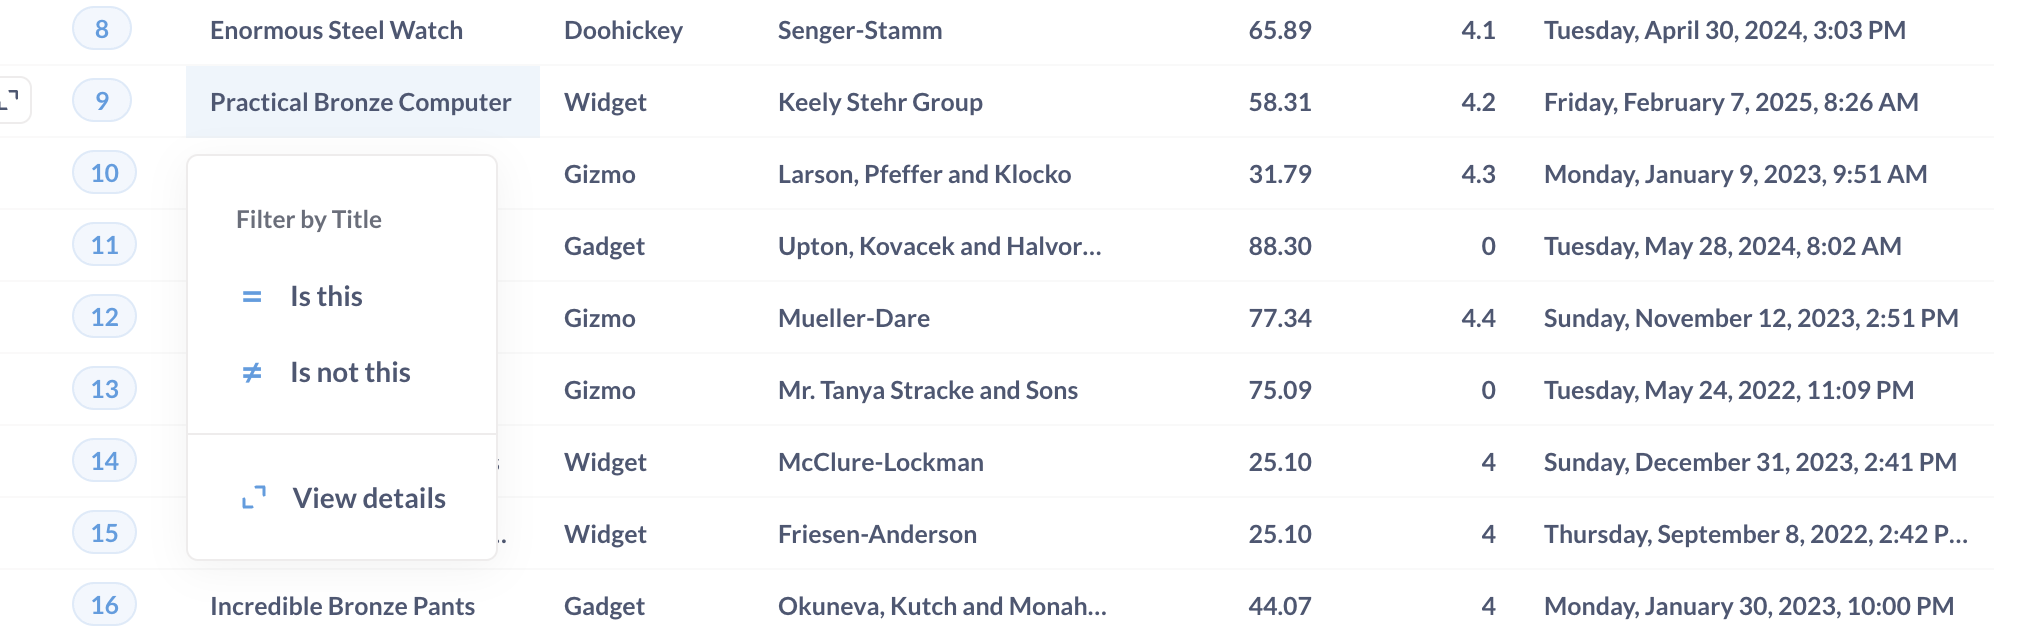
Column heading options for filtering and summarizing
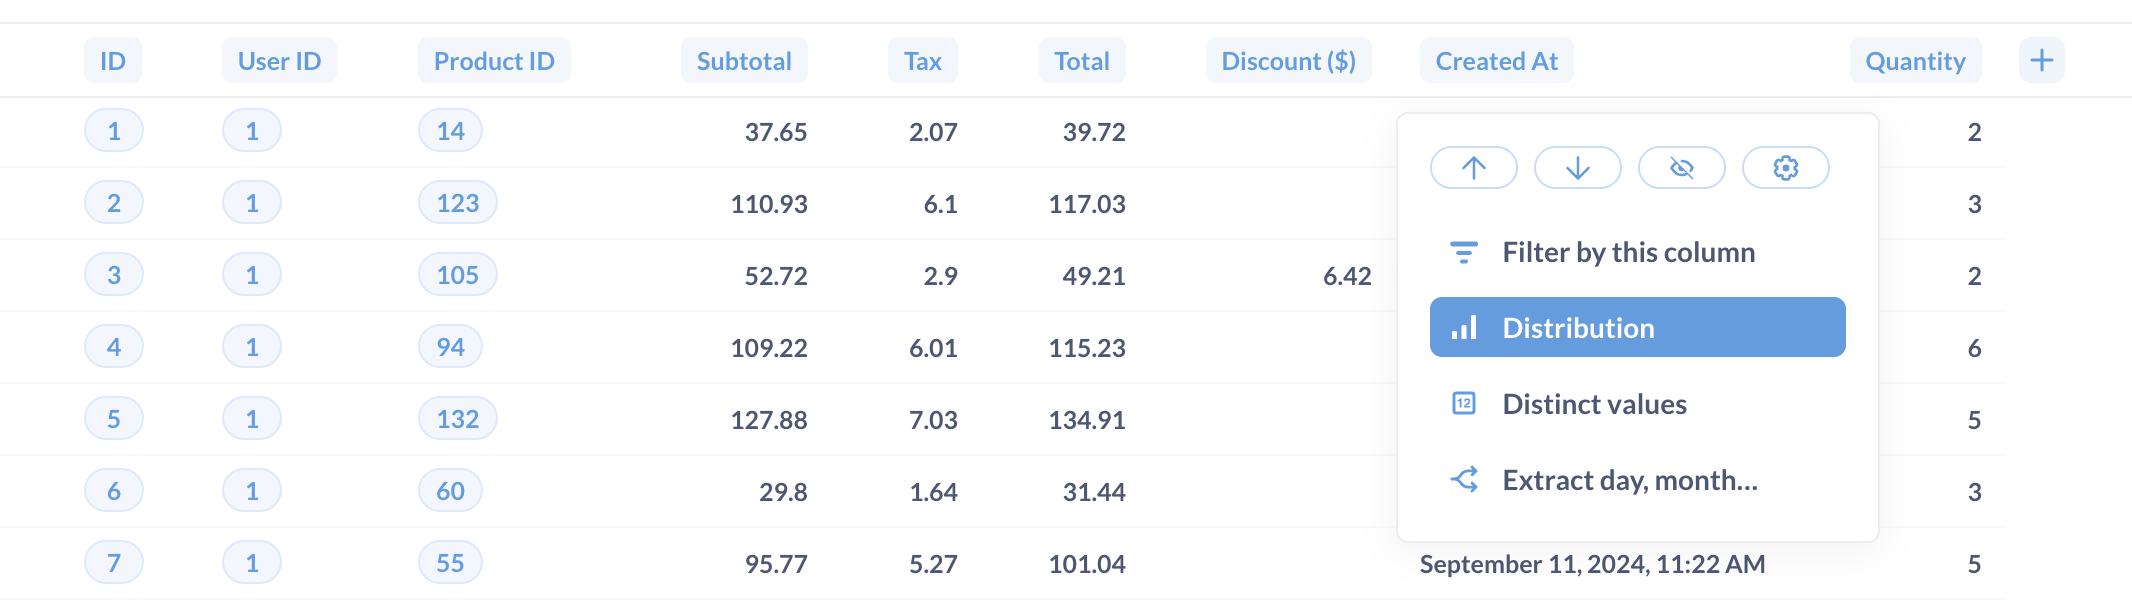
Click on a column heading and Metabase will present quick options for filtering and summarizing the data. The options for the column depend on the column’s data type (ID, Text, Number, Date).
Filter by this column
You can enter a value and filter the column value:
Text filters:
- Is / Is not
- Contains / Does not contain
- Starts with / Ends with
- Is empty / Not empty
Number filters:
- Between
- Greater than / Less than
- Greater than or equal to / Less than or equal to
- Equal to / Not equal to
- Is empty / Not empty
Distribution
Clicking on Distribution will summarize the data by counting the rows and grouping the counts by the values in the column.
Distinct values
Get a count of unique values.
Combine columns
You can combine one or more text columns. For example, a first name column with a last name column.
You can tell Metabase how to combine the columns by specifying a separator, like a space, or comma, or the word “Danger”.
Extract day, month…
From a datetime, you can grab:
- Hour of day: 0, 1, 2…
- Day of month: 0, 1, 2…
- Day of week: Monday, Tuesday…
- Month of year: Jan, Feb…
- Quarter of year: Q1, Q2…
- Year: 2024, 2025…
Extract domain, subdomain, host, or path
Grab the domain or host from a URL or email. So if you have https://www.example.com/path/to/page#heading-on-page:
- Host:
example.com - Domain:
example - Subdomain:
www - Path:
/path/to/page
Extracting parts of a URL or email is unavailable for MongoDB, SQLite, and SQL Server. For Druid, extracting domain and host is only available for the Druid-JDBC driver.
Sum over time
Add up all the values and group by a time period, generally by month.
Table cell click options
Clicking on a table cell will give you different options based on the data type and its values.
Detail views
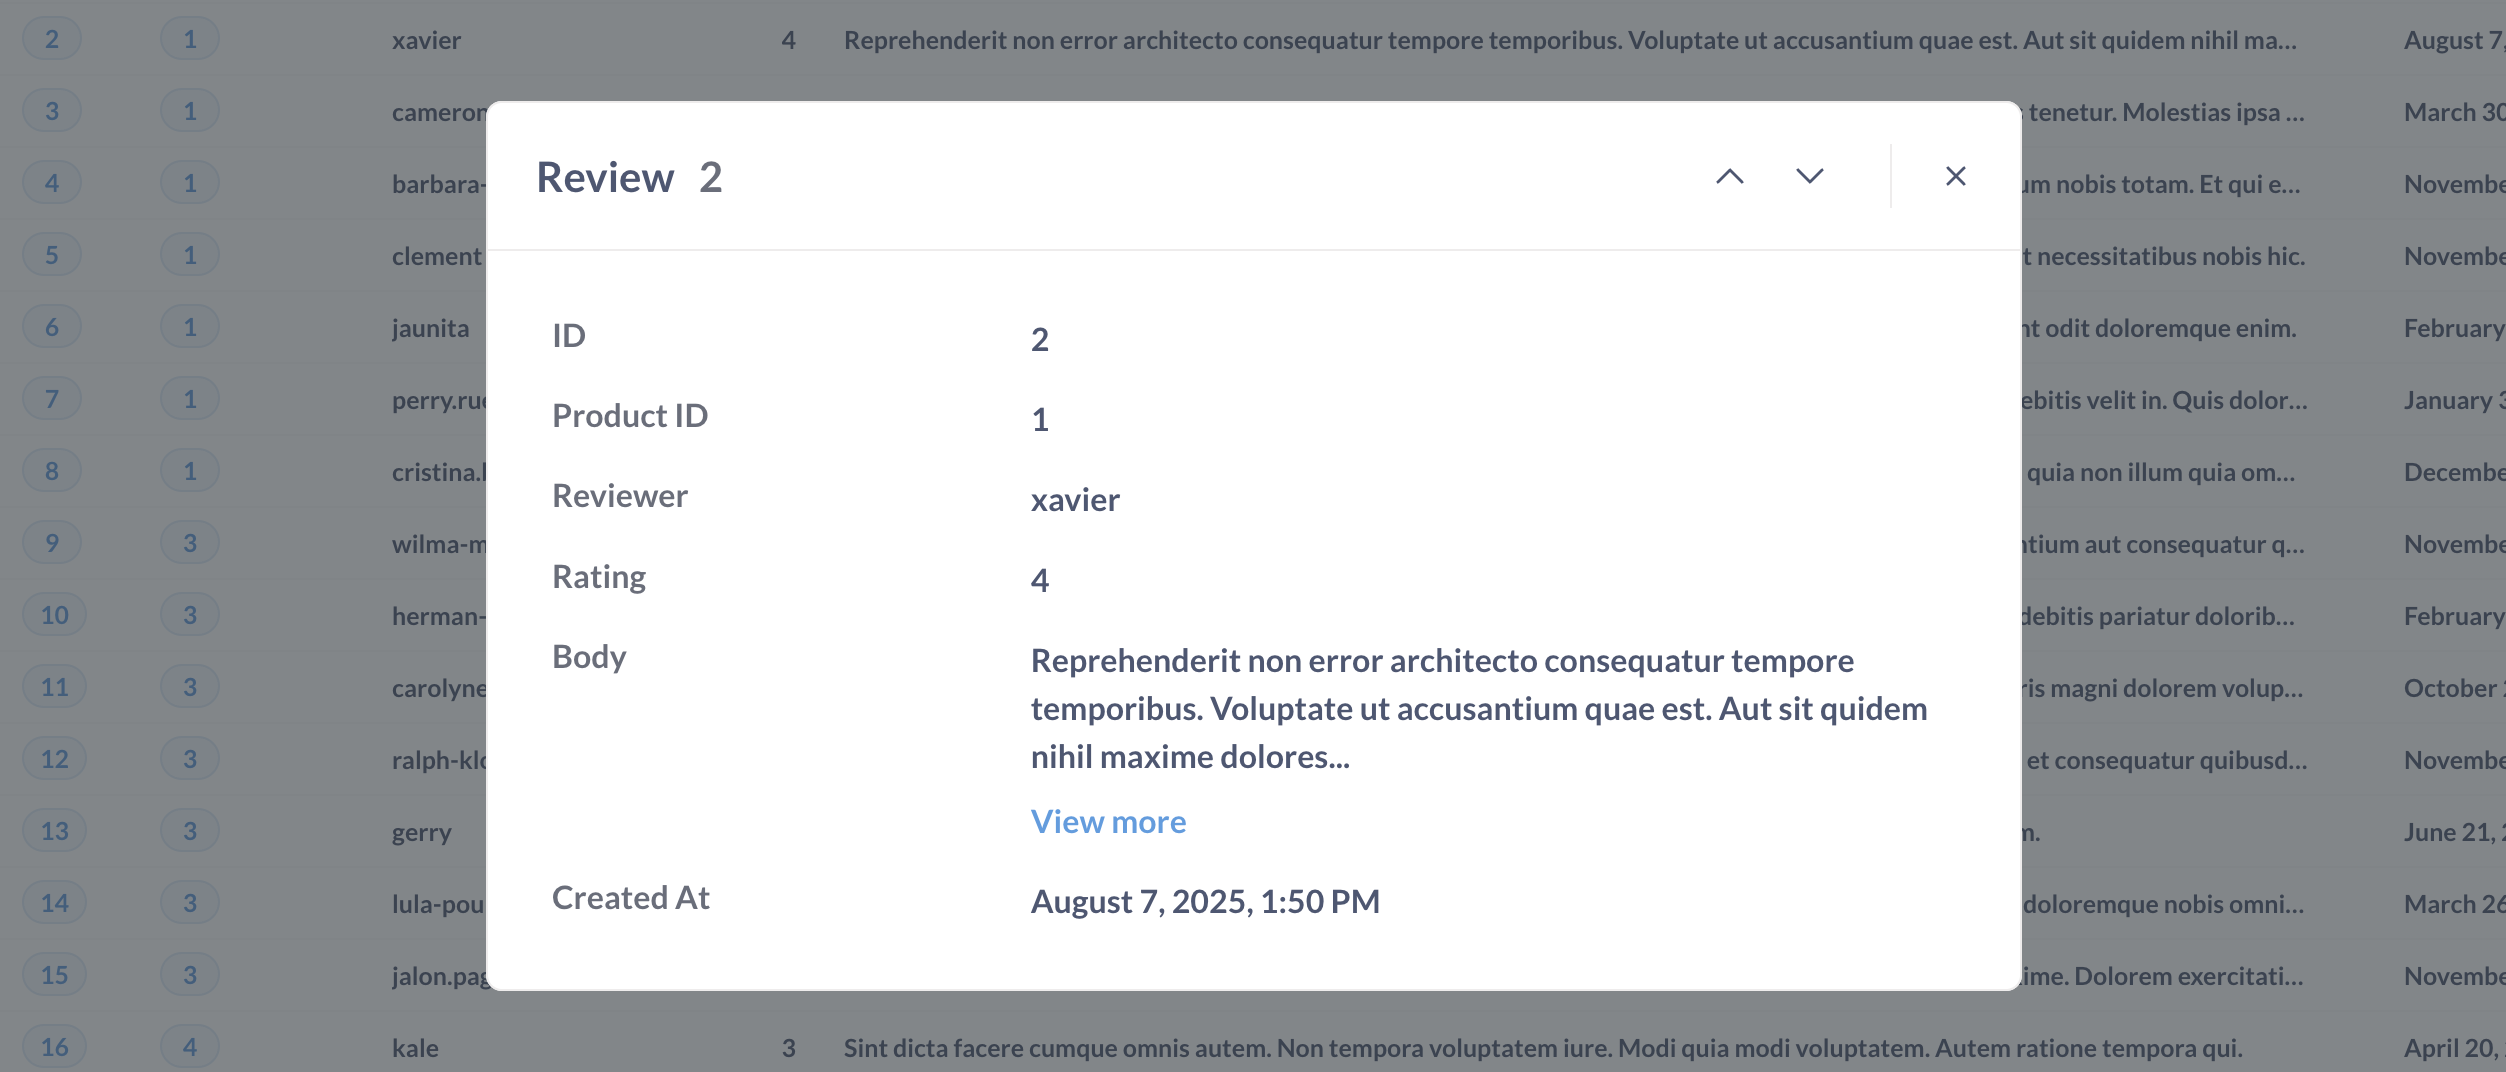
To make records easier to read, you can click on an entity key column (either a primary or foreign key) to bring up a detail view. For example, clicking on an order ID will bring up details from that order.
Column formatting options
To format the display of any column in a table, click on the column heading and choose the Formatting option (you can also get there by clicking on the gear on any column when in the Columns tab of the visualization settings).

The options you see will differ depending on the type of column you’re viewing:
Text formatting options
Title
You can rename the column.
Align text
You can display the text on the left, right, or in the middle (i.e., centered) of the column.
Wrap text
You can toggle text wrapping, which is useful for columns with long text values like comments.
Display as
You can display a column as:
Display text as a link
If you select link, you can also change the text displayed, and use parameters for both the link text and the link’s URL.
For example, you could create a dynamic URL using a parameter from another column in the results:
https://www.example.com/{{category}}
In the above example, Metabase would take the value for the category column for that row (in this case widget), and insert it into the URL:
https://www.example.com/widget
Display URL as an image
If you select image, and the text is a link to an image asset, Metabase will display the image in the table cell.
Date formatting options
Date formatting options include the same options as Text formatting, as well as:
Align date
You can display the date on the left, right, or in the middle (i.e., centered) of the column.
Date style
Styles include:
- April 1, 2024
- 1 April 2024
- Monday, April 1, 2024
- 4/1/2024
- 1/4/2024
- 2024/4/1
Abbreviate days and months
If you select a date style that includes words, this toggle will abbreviate them. For example:
- Unabbreviated: Monday, April 1, 2024
- Abbreviated: Mon, Apr 1, 2024
Show the time
This option determines whether Metabase includes the time along with the date.
- Off
- HH:MM
- HH:MM:SS
- HH:MM:SS:MS
Time style
You can choose either 12-hour clock style, or 24-hour clock style.
- 5:24 PM (12-hour clock)
- 17:24 (24-hour clock)
Number formatting options
Show a mini bar chart
This option displays a small horizontal bar next to each number in this column to show its size relative to the other values in the column.
Style
Number styles include:
- Number
- Percent
- Scientific
- Currency
Separator style
Gives you various options for how commas and periods are used to separate the number.
- 100,000.00
- 100 000,00
- 100.000,00
- 100000.00
- 100’000.00
Number of decimal places
Forces the number to be displayed with exactly this many decimal places.
Multiply by a number
Multiplies each number in this column by whatever you type here. Just don’t type an emoji here; there is a nontrivial chance that it will manifest a temporal vortex.
Add a prefix/suffix
Lets you put a symbol, word, or whatever before or after each cell’s value.
Currency formatting options
Currency columns have all the same options as numbers, plus the following:
Unit of Currency
Lets you change the unit of currency from whatever the system default is.
Currency label style
Choose how to display the currency label. For example, for Canadian dollars:
- Symbol:
CA$ - Local symbol:
$ - Code:
CAD - Name:
Canadian dollars
Where to display the unit of currency
Lets you toggle between showing the currency label in the column heading or in every cell in the column.
Conditional table formatting
Sometimes it’s helpful to highlight certain rows or columns in your tables when they meet a specific condition. You can set up conditional formatting rules by going to the visualization settings while looking at any table, then clicking on the Conditional Formatting tab.

When you add a new rule, you’ll first need to pick which column(s) should be affected. Your columns can be formatted in one of two ways:
- Single color. Pick single color if you want to highlight cells in the column if they’re greater, less than, or equal to a specific number, or if they match or contain a certain word or phrase. You can optionally highlight the whole row of a cell that matches the condition you pick so that it’s easier to spot as you scroll down your table.
- Color range. Choose color range if you want to tint all the cells in the column from smallest to largest or vice versa. This option is only available for numeric columns.
You can set as many rules on a table as you want, and change the order in which those rules are applied. If two or more rules disagree with each other, the rule that’s on the top of your list of rules will win. You can click and drag your rules to reorder them, and click on a rule to edit it.
Adding tables to dashboards
When you add a table to a dashboard, you can add custom destinations to individual columns, wire up filter widgets, and more. To see an example of a table used in a dashboard, check out our article on building a record lookup tool with Metabase.
Table pagination on dashboard cards
When you add a table to dashboard, the table will be scrollable by default. You can paginate the rows by:
- Clicking on the Pencil icon to edit the dashboard.
- Hovering over the dashcard containing the table, and clicking the Visualization icon.
- In the Columns tab, toggle on Paginate results.
Foreign key remapping
Here’s one last cool feature, though it requires an admin to change some settings in the Data Model section. Foreign keys are useful, but they’re generally not meaningful for (human) readers. Instead of displaying a foreign key as a number, say a product ID, it’d be nice to display the values as the product’s Title. Metabase can substitute foreign keys with values from the foreign table that are associated with that entity key. What this means is that instead of showing the Product_ID value, you can set it up so that people will instead see the product Title, like “Lightweight Wool Computer.” Your Metabase admins can set this up in the Admin Panel in the Data Model tab. In this case, we’ll select the Orders table, and change the foreign key from the Products table to instead display in the Order table as the Product → Title.
Pivoted tables
This auto-pivoting is distinct from the pivot table visualization.
If your table is a result that contains one numeric column and two grouping columns, Metabase can “pivot” your table, like in the example below, where row values for the Category column (Doohickey, Gadget, Gizmo and Widget) become column headings. If you open up the visualization settings by clicking the gear icon, you can choose which column to pivot in case Metabase got it wrong. You can also turn off the pivoting behavior entirely.

Table export options
See Exporting results.
Read docs for other versions of Metabase.